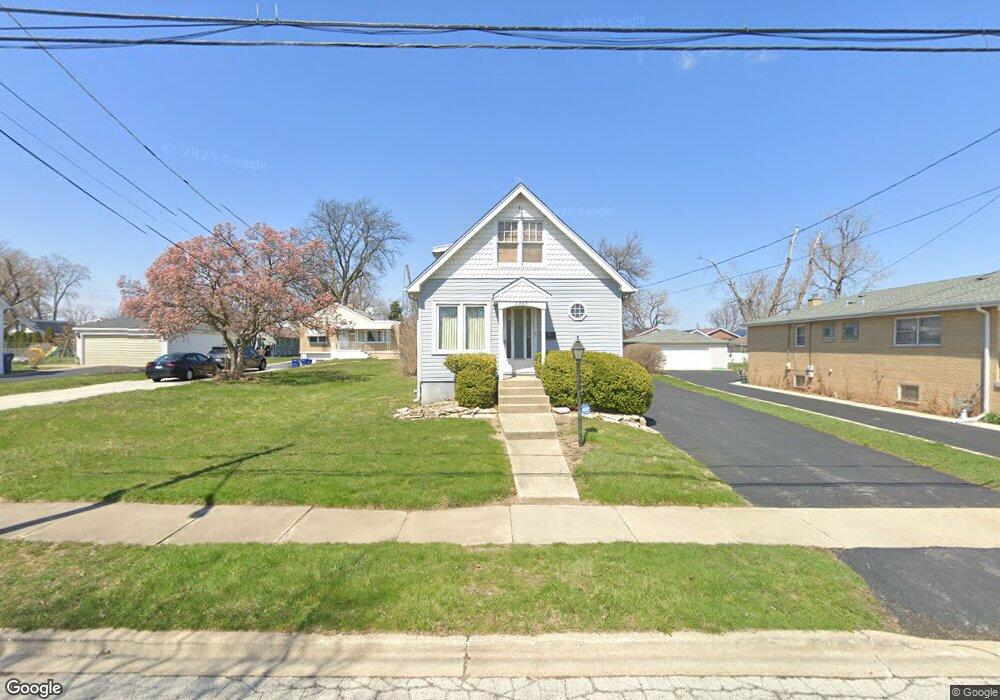
5906 W Maple Ave Berkeley, IL 60163
Estimated Value: $283,000 - $357,000
4
Beds
2
Baths
1,860
Sq Ft
$174/Sq Ft
Est. Value
About This Home
This home is located at 5906 W Maple Ave, Berkeley, IL 60163 and is currently estimated at $324,250, approximately $174 per square foot. 5906 W Maple Ave is a home located in Cook County with nearby schools including Macarthur Intermediate School, Sunnyside Elementary School, and Proviso West High School.
Ownership History
Date
Name
Owned For
Owner Type
Purchase Details
Closed on
Jul 29, 2022
Sold by
Rich Carol A and Rich James K
Bought by
Chicago Title Land Trust Company
Current Estimated Value
Purchase Details
Closed on
Nov 6, 1998
Sold by
Rich Carol A and Rich James K
Bought by
Rich Carol A
Home Financials for this Owner
Home Financials are based on the most recent Mortgage that was taken out on this home.
Original Mortgage
$67,000
Interest Rate
6.95%
Purchase Details
Closed on
Oct 31, 1995
Sold by
Thorsen Carol A and Rich Carol A
Bought by
Rich James K and Rich Carol A
Home Financials for this Owner
Home Financials are based on the most recent Mortgage that was taken out on this home.
Original Mortgage
$50,000
Interest Rate
7.28%
Create a Home Valuation Report for This Property
The Home Valuation Report is an in-depth analysis detailing your home's value as well as a comparison with similar homes in the area
Home Values in the Area
Average Home Value in this Area
Purchase History
| Date | Buyer | Sale Price | Title Company |
|---|---|---|---|
| Chicago Title Land Trust Company | -- | None Listed On Document | |
| Rich Carol A | -- | Prairie Title | |
| Rich James K | -- | -- |
Source: Public Records
Mortgage History
| Date | Status | Borrower | Loan Amount |
|---|---|---|---|
| Previous Owner | Rich Carol A | $67,000 | |
| Previous Owner | Rich James K | $50,000 | |
| Closed | Rich James K | $66,000 |
Source: Public Records
Tax History
| Year | Tax Paid | Tax Assessment Tax Assessment Total Assessment is a certain percentage of the fair market value that is determined by local assessors to be the total taxable value of land and additions on the property. | Land | Improvement |
|---|---|---|---|---|
| 2025 | $7,793 | $23,842 | $4,813 | $19,029 |
| 2024 | $7,793 | $23,842 | $4,813 | $19,029 |
| 2023 | $5,626 | $27,001 | $4,813 | $22,188 |
| 2022 | $5,626 | $18,962 | $3,281 | $15,681 |
| 2021 | $5,679 | $18,961 | $3,281 | $15,680 |
| 2020 | $5,524 | $18,961 | $3,281 | $15,680 |
| 2019 | $5,620 | $19,433 | $3,062 | $16,371 |
| 2018 | $5,506 | $19,433 | $3,062 | $16,371 |
| 2017 | $5,306 | $19,433 | $3,062 | $16,371 |
| 2016 | $4,581 | $15,599 | $2,843 | $12,756 |
| 2015 | $4,481 | $15,599 | $2,843 | $12,756 |
| 2014 | $5,174 | $17,459 | $2,843 | $14,616 |
| 2013 | $4,419 | $16,578 | $2,843 | $13,735 |
Source: Public Records
Map
Nearby Homes
- 5949 School St
- 1428 1/2 N Ashbel Ave
- 1447 N Ashbel Ave
- 593 S Edgewood Ave
- 4938 W Randolph St
- 515 S Parkview Ave
- 1529 N Hillside Ave
- 5706 Saint Charles Rd
- 504 N Irving Ave
- 5700 Saint Charles Rd
- 5905 Superior St
- 4904 W Hawthorne Ave
- 2050 Atwood Ave
- 605 N Wolf Rd Unit B9
- 520 N Wolf Rd Unit 203
- 250 N Irving Ave
- 522 E Park Manor Ct
- 330 E Saint Charles Rd
- 406 S Poplar Ave
- 226 N Lind Ave
- 5908 W Maple Ave
- 5904 W Maple Ave
- 5912 W Maple Ave
- 5902 W Maple Ave
- 5916 W Maple Ave
- 5907 Burr Oak Ave
- 5905 Burr Oak Ave
- 5911 Burr Oak Ave
- 5903 Burr Oak Ave
- 5842 W Maple Ave
- 5920 W Maple Ave
- 5907 W Maple Ave
- 5905 W Maple Ave
- 5909 W Maple Ave
- 5901 Burr Oak Ave
- 5913 Burr Oak Ave
- 5913 1/2 Burr Oak Ave
- 5849 W Maple Ave
- 5845 Burr Oak Ave
- 5845 W Maple Ave
Your Personal Tour Guide
Ask me questions while you tour the home.