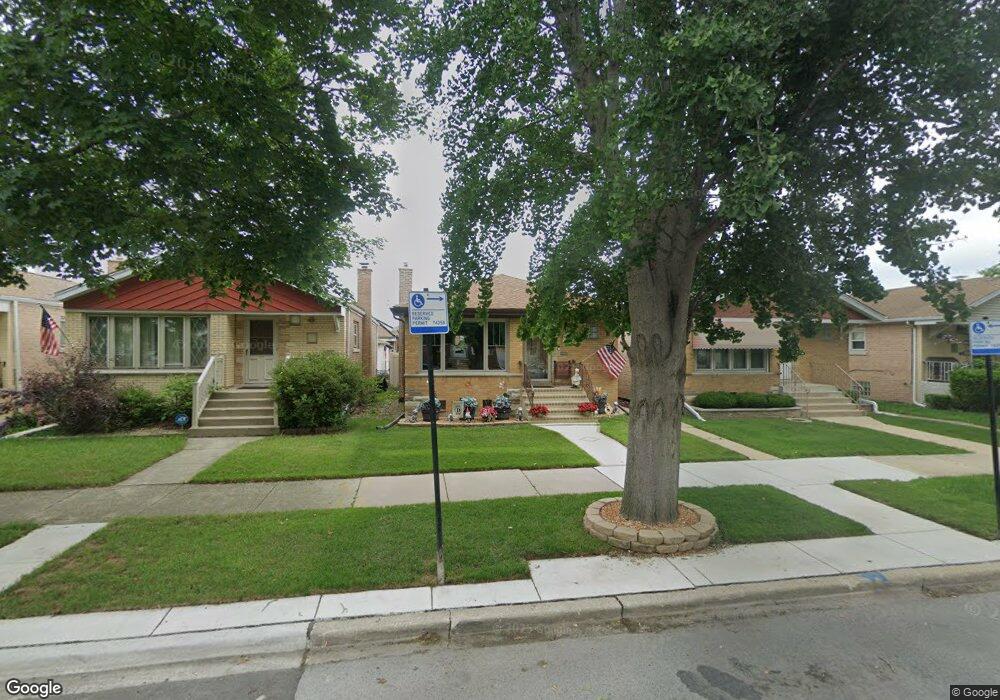
5908 W 64th St Chicago, IL 60638
Clearing NeighborhoodEstimated Value: $294,000 - $355,000
2
Beds
1
Bath
945
Sq Ft
$341/Sq Ft
Est. Value
About This Home
This home is located at 5908 W 64th St, Chicago, IL 60638 and is currently estimated at $321,950, approximately $340 per square foot. 5908 W 64th St is a home located in Cook County with nearby schools including Hale Elementary School, Kennedy High School, and St. Symphorosa Catholic School.
Ownership History
Date
Name
Owned For
Owner Type
Purchase Details
Closed on
Aug 13, 2001
Sold by
Flanagan Thomas and Gavin Patricia H
Bought by
Deitelhoff Raymond E and Daniels Linda T
Current Estimated Value
Home Financials for this Owner
Home Financials are based on the most recent Mortgage that was taken out on this home.
Original Mortgage
$130,000
Outstanding Balance
$48,542
Interest Rate
7.03%
Mortgage Type
Purchase Money Mortgage
Estimated Equity
$273,408
Purchase Details
Closed on
Oct 24, 1997
Sold by
Paries Darryle M and Paries Caron L
Bought by
Flanagan Thomas and Gavin Patricia H
Home Financials for this Owner
Home Financials are based on the most recent Mortgage that was taken out on this home.
Original Mortgage
$58,000
Interest Rate
8.5%
Mortgage Type
Purchase Money Mortgage
Create a Home Valuation Report for This Property
The Home Valuation Report is an in-depth analysis detailing your home's value as well as a comparison with similar homes in the area
Home Values in the Area
Average Home Value in this Area
Purchase History
| Date | Buyer | Sale Price | Title Company |
|---|---|---|---|
| Deitelhoff Raymond E | $150,000 | Ticor Title | |
| Flanagan Thomas | $55,333 | -- |
Source: Public Records
Mortgage History
| Date | Status | Borrower | Loan Amount |
|---|---|---|---|
| Open | Deitelhoff Raymond E | $130,000 | |
| Previous Owner | Flanagan Thomas | $58,000 |
Source: Public Records
Tax History
| Year | Tax Paid | Tax Assessment Tax Assessment Total Assessment is a certain percentage of the fair market value that is determined by local assessors to be the total taxable value of land and additions on the property. | Land | Improvement |
|---|---|---|---|---|
| 2025 | $3,171 | $26,000 | $4,998 | $21,002 |
| 2024 | $3,171 | $26,000 | $4,998 | $21,002 |
| 2023 | $3,053 | $21,001 | $4,463 | $16,538 |
| 2022 | $3,053 | $21,001 | $4,463 | $16,538 |
| 2021 | $3,017 | $20,999 | $4,462 | $16,537 |
| 2020 | $2,643 | $17,449 | $3,570 | $13,879 |
| 2019 | $2,655 | $19,388 | $3,570 | $15,818 |
| 2018 | $2,608 | $19,388 | $3,570 | $15,818 |
| 2017 | $2,260 | $16,575 | $3,213 | $13,362 |
| 2016 | $2,462 | $16,575 | $3,213 | $13,362 |
| 2015 | $2,213 | $16,575 | $3,213 | $13,362 |
| 2014 | $2,080 | $15,611 | $3,034 | $12,577 |
| 2013 | $2,019 | $15,611 | $3,034 | $12,577 |
Source: Public Records
Map
Nearby Homes
- 5817 W 64th St
- 6019 W 64th Place Unit 23-4
- 5758 W 64th Place
- 5749 W 64th Place
- 6054 W 64th St
- 7754 S Mcvicker Ave
- 5729 W 63rd St Unit 3N
- 5718 W 63rd Place
- 6111 W 64th Place Unit 2
- 6207 S Austin Ave
- 6152 S Austin Ave
- 5631 W 64th Place
- 6230 W 63rd Place
- 5542 W 64th St
- 6058 S Massasoit Ave
- 6129 S Parkside Ave
- 6323 W 64th Place Unit 1D
- 6005 S Menard Ave
- 5818 W 60th St
- 5423 W 63rd Place
- 5910 W 64th St
- 5904 W 64th St
- 5914 W 64th St
- 5900 W 64th St
- 5914 64th
- 5916 W 64th St
- 5920 W 64th St
- 5909 W 63rd Place
- 5911 W 63rd Place
- 5905 W 63rd Place
- 5915 W 63rd Place
- 5922 W 64th St
- 5901 W 63rd Place
- 5858 W 64th St
- 5926 W 64th St
- 5921 W 63rd Place
- 5919 W 63rd Place
- 5919 W 63rd Place Unit 1A
- 5909 W 64th St
- 5911 W 64th St
Your Personal Tour Guide
Ask me questions while you tour the home.