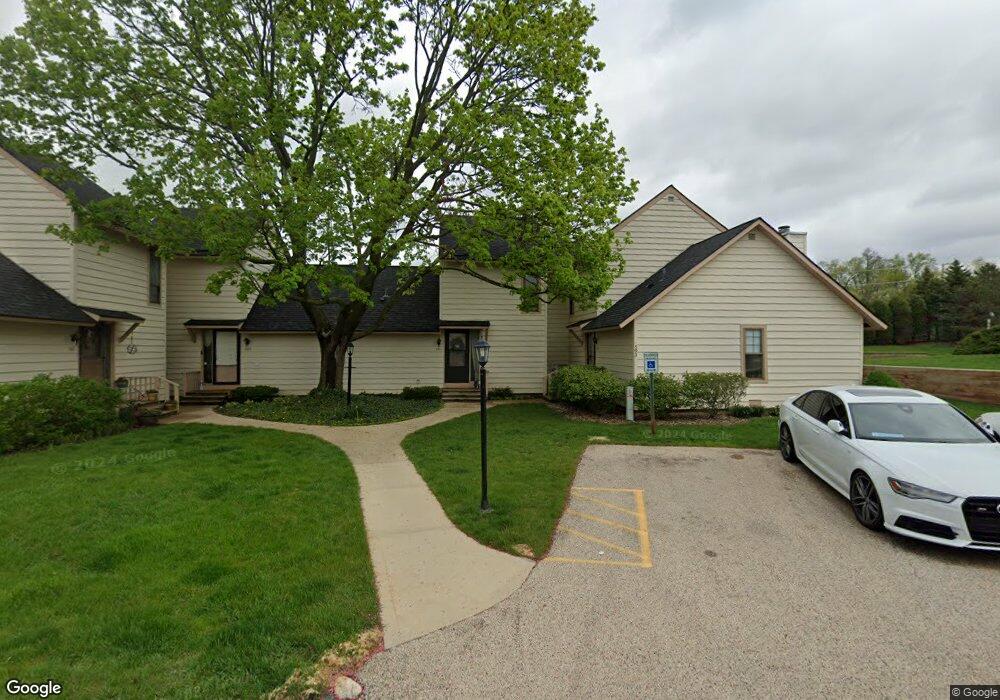
591 Dunham Rd Unit U313 Gurnee, IL 60031
Estimated Value: $211,218 - $227,000
2
Beds
2
Baths
1,162
Sq Ft
$189/Sq Ft
Est. Value
About This Home
This home is located at 591 Dunham Rd Unit U313, Gurnee, IL 60031 and is currently estimated at $220,055, approximately $189 per square foot. 591 Dunham Rd Unit U313 is a home located in Lake County with nearby schools including Woodland Primary School, Woodland Elementary School, and Woodland Intermediate School.
Ownership History
Date
Name
Owned For
Owner Type
Purchase Details
Closed on
Nov 21, 2003
Sold by
Hud
Bought by
Bank Financial Fsb and Trust #010701
Current Estimated Value
Home Financials for this Owner
Home Financials are based on the most recent Mortgage that was taken out on this home.
Original Mortgage
$79,080
Interest Rate
4.25%
Mortgage Type
Unknown
Purchase Details
Closed on
Jun 26, 2003
Sold by
Green Kathleen
Bought by
Hud
Purchase Details
Closed on
Mar 16, 2001
Sold by
Singer Wendy I
Bought by
Green Kathleen E
Home Financials for this Owner
Home Financials are based on the most recent Mortgage that was taken out on this home.
Original Mortgage
$119,622
Interest Rate
7.13%
Mortgage Type
FHA
Purchase Details
Closed on
Jul 31, 1997
Sold by
Oreilly William P
Bought by
Singer Wendy I
Home Financials for this Owner
Home Financials are based on the most recent Mortgage that was taken out on this home.
Original Mortgage
$84,800
Interest Rate
7.68%
Create a Home Valuation Report for This Property
The Home Valuation Report is an in-depth analysis detailing your home's value as well as a comparison with similar homes in the area
Home Values in the Area
Average Home Value in this Area
Purchase History
| Date | Buyer | Sale Price | Title Company |
|---|---|---|---|
| Bank Financial Fsb | -- | Stewart Title Company | |
| Hud | -- | -- | |
| Green Kathleen E | $121,500 | Burnet Title Llc | |
| Singer Wendy I | $58,333 | Chicago Title Insurance Co |
Source: Public Records
Mortgage History
| Date | Status | Borrower | Loan Amount |
|---|---|---|---|
| Previous Owner | Bank Financial Fsb | $79,080 | |
| Previous Owner | Green Kathleen E | $119,622 | |
| Previous Owner | Singer Wendy I | $84,800 |
Source: Public Records
Tax History Compared to Growth
Tax History
| Year | Tax Paid | Tax Assessment Tax Assessment Total Assessment is a certain percentage of the fair market value that is determined by local assessors to be the total taxable value of land and additions on the property. | Land | Improvement |
|---|---|---|---|---|
| 2024 | $4,321 | $56,983 | $8,185 | $48,798 |
| 2023 | $4,321 | $52,904 | $7,599 | $45,305 |
| 2022 | $4,321 | $44,333 | $5,929 | $38,404 |
| 2021 | $3,693 | $40,146 | $5,369 | $34,777 |
| 2020 | $3,579 | $39,159 | $5,237 | $33,922 |
| 2019 | $3,480 | $38,022 | $5,085 | $32,937 |
| 2018 | $2,986 | $32,973 | $2,676 | $30,297 |
| 2017 | $2,979 | $32,028 | $2,599 | $29,429 |
| 2016 | $2,941 | $30,602 | $2,483 | $28,119 |
| 2015 | $2,875 | $29,023 | $2,355 | $26,668 |
| 2014 | $2,439 | $24,806 | $2,323 | $22,483 |
| 2012 | $3,609 | $27,713 | $2,341 | $25,372 |
Source: Public Records
Map
Nearby Homes
- 690 Chandler Rd Unit 207
- 690 Chandler Rd Unit 305
- 651 White Ct
- 638 Dordan Ct
- 741 Colby Ct Unit U42
- 6121 Brookstone Place
- 776 Chandler Rd
- 6161 Oakmont Ln
- 711 Creekside Cir Unit 103
- 600 Creekside Cir Unit 85
- 6191 Oakmont Ln
- 640 Wilbur Ct
- 6296 Doral Dr
- 6141 Crossland Blvd
- 917 Vose Dr Unit 304
- 920 Vose Dr Unit 304
- 920 Vose Dr Unit 106
- 920 Vose Dr Unit 105
- 914 Vose Dr
- 6359 Doral Dr
- 593 Dunham Rd
- 589 Dunham Rd Unit U312
- 587 Dunham Rd
- 597 Dunham Rd Unit U320
- 595 Dunham Rd Unit 319
- 581 Dunham Rd Unit U306
- 599 Dunham Rd
- 579 Dunham Rd Unit U305
- 594 Dunham Rd Unit U301
- 601 Dunham Rd
- 577 Dunham Rd
- 588 Dunham Rd
- 596 Dunham Rd Unit U299
- 575 Dunham Rd Unit U303
- 590 Dunham Rd Unit U298
- 598 Dunham Rd Unit U297
- 602 Dunham Rd Unit U310
- 604 Dunham Rd Unit U309
- 600 Dunham Rd Unit U295
- 600 Dunham Rd Unit 600