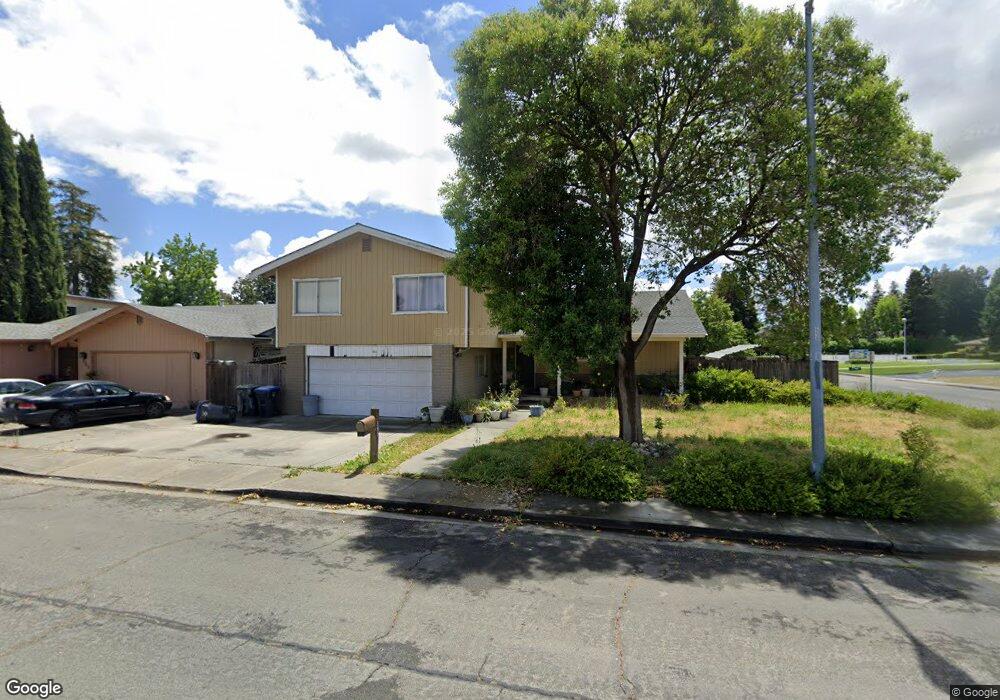
591 Flores Ct Fairfield, CA 94533
Estimated Value: $575,436 - $648,000
4
Beds
3
Baths
2,358
Sq Ft
$259/Sq Ft
Est. Value
About This Home
This home is located at 591 Flores Ct, Fairfield, CA 94533 and is currently estimated at $609,609, approximately $258 per square foot. 591 Flores Ct is a home located in Solano County with nearby schools including David Weir Preparatory Academy, Grange Middle School, and Fairfield High School.
Ownership History
Date
Name
Owned For
Owner Type
Purchase Details
Closed on
Jan 6, 2018
Sold by
Horton Deborah A
Bought by
Horton Deborah A
Current Estimated Value
Home Financials for this Owner
Home Financials are based on the most recent Mortgage that was taken out on this home.
Original Mortgage
$258,000
Interest Rate
3.9%
Mortgage Type
New Conventional
Purchase Details
Closed on
Oct 19, 2011
Sold by
Horton Ricky D
Bought by
Horton Deborah A
Create a Home Valuation Report for This Property
The Home Valuation Report is an in-depth analysis detailing your home's value as well as a comparison with similar homes in the area
Home Values in the Area
Average Home Value in this Area
Purchase History
| Date | Buyer | Sale Price | Title Company |
|---|---|---|---|
| Horton Deborah A | -- | Fidelity National Title Co | |
| Horton Deborah A | -- | None Available |
Source: Public Records
Mortgage History
| Date | Status | Borrower | Loan Amount |
|---|---|---|---|
| Closed | Horton Deborah A | $258,000 |
Source: Public Records
Tax History Compared to Growth
Tax History
| Year | Tax Paid | Tax Assessment Tax Assessment Total Assessment is a certain percentage of the fair market value that is determined by local assessors to be the total taxable value of land and additions on the property. | Land | Improvement |
|---|---|---|---|---|
| 2025 | $3,522 | $321,426 | $91,985 | $229,441 |
| 2024 | $3,522 | $315,125 | $90,182 | $224,943 |
| 2023 | $3,412 | $308,947 | $88,414 | $220,533 |
| 2022 | $3,369 | $302,890 | $86,681 | $216,209 |
| 2021 | $3,335 | $296,952 | $84,982 | $211,970 |
| 2020 | $3,256 | $293,908 | $84,111 | $209,797 |
| 2019 | $3,174 | $288,146 | $82,462 | $205,684 |
| 2018 | $3,275 | $282,497 | $80,846 | $201,651 |
| 2017 | $3,122 | $276,959 | $79,261 | $197,698 |
| 2016 | $3,095 | $271,529 | $77,707 | $193,822 |
| 2015 | $2,888 | $267,451 | $76,540 | $190,911 |
| 2014 | $2,861 | $262,213 | $75,041 | $187,172 |
Source: Public Records
Map
Nearby Homes
- 2256 Dorset Ln
- 2289 Rutland Ct
- 2284 Wiltshire Ct
- 50 Anza Ct
- 937 Pacific Ave
- 249 Dahlia St
- 205 Alaska Ave
- 280 Dahlia St
- 223 Camellia St
- 799 Tabor Ave
- 751 Hillcrest Ct
- 2215 Cunningham Dr
- 2207 Cunningham Dr
- 954 Coventry Ln
- 1831 Clay St
- 1309 Sunningdale Ln
- 1301 Sunningdale Ln
- Cora Plan at Brighton Place
- Bryce Plan at Brighton Place
- 1305 Sunningdale Ln