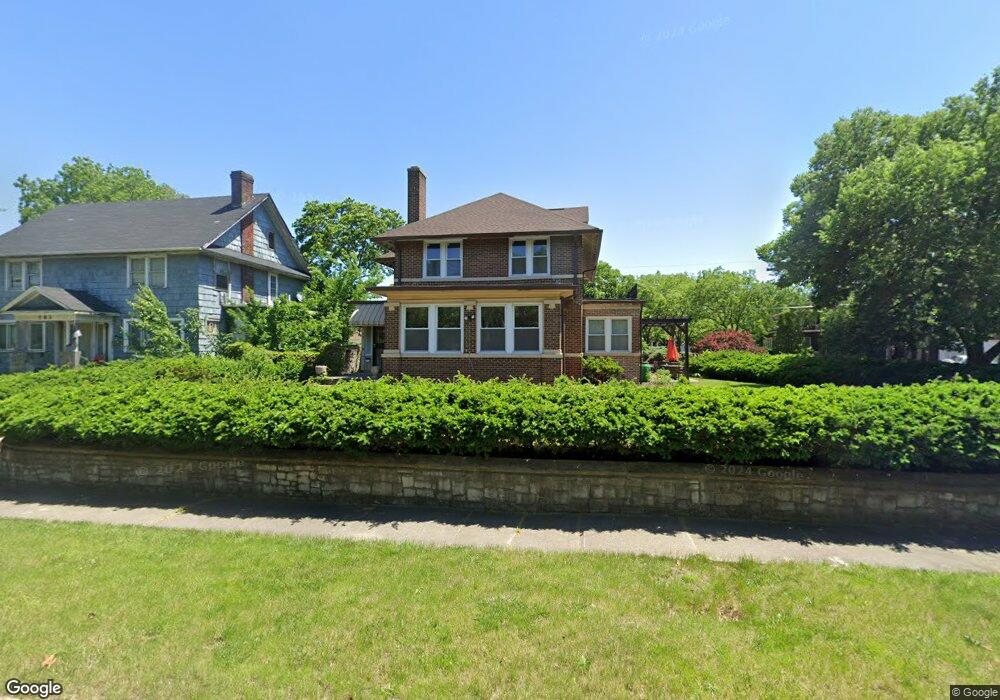
591 Johnson St Gary, IN 46402
Downtown Gary NeighborhoodEstimated Value: $173,000 - $275,000
4
Beds
3
Baths
3,350
Sq Ft
$67/Sq Ft
Est. Value
About This Home
This home is located at 591 Johnson St, Gary, IN 46402 and is currently estimated at $224,939, approximately $67 per square foot. 591 Johnson St is a home located in Lake County with nearby schools including Beveridge Elementary School, Gary Middle School, and West Side Leadership Academy.
Ownership History
Date
Name
Owned For
Owner Type
Purchase Details
Closed on
Jul 8, 2021
Sold by
Edwards Deanda A
Bought by
Edwards Jeffrey and Edwards Deanda A
Current Estimated Value
Home Financials for this Owner
Home Financials are based on the most recent Mortgage that was taken out on this home.
Original Mortgage
$60,000
Outstanding Balance
$44,702
Interest Rate
2.96%
Mortgage Type
New Conventional
Estimated Equity
$180,237
Purchase Details
Closed on
Jul 13, 2015
Sold by
Edward Deanda
Bought by
Edwards Jeffery and Edwards Deanda
Purchase Details
Closed on
Sep 12, 2014
Sold by
The Secretary Of Veterans Affairs
Bought by
Edwards Deanda A
Purchase Details
Closed on
Aug 3, 2012
Sold by
Rivers Ulysses Trent
Bought by
The Secretary Of Veterans Affairs
Purchase Details
Closed on
Dec 6, 2011
Sold by
Rivers Cherrie
Bought by
Rivers Cherrie
Purchase Details
Closed on
Nov 18, 2011
Sold by
Rivers Cherrie
Bought by
Rivers Cherrie
Create a Home Valuation Report for This Property
The Home Valuation Report is an in-depth analysis detailing your home's value as well as a comparison with similar homes in the area
Home Values in the Area
Average Home Value in this Area
Purchase History
| Date | Buyer | Sale Price | Title Company |
|---|---|---|---|
| Edwards Jeffrey | -- | Greater Indiana Title Co | |
| Edwards Jeffery | -- | Attorney | |
| Edwards Deanda A | $30,000 | Chicago Title Insurance Co | |
| The Secretary Of Veterans Affairs | $77,554 | None Available | |
| Rivers Cherrie | -- | None Available | |
| Rivers Cherrie | -- | None Available |
Source: Public Records
Mortgage History
| Date | Status | Borrower | Loan Amount |
|---|---|---|---|
| Open | Edwards Jeffrey | $60,000 |
Source: Public Records
Tax History
| Year | Tax Paid | Tax Assessment Tax Assessment Total Assessment is a certain percentage of the fair market value that is determined by local assessors to be the total taxable value of land and additions on the property. | Land | Improvement |
|---|---|---|---|---|
| 2025 | $1,508 | $178,900 | $10,800 | $168,100 |
| 2024 | $11,339 | $161,800 | $10,800 | $151,000 |
| 2023 | $1,408 | $128,600 | $11,500 | $117,100 |
| 2022 | $1,477 | $130,500 | $7,300 | $123,200 |
| 2021 | $1,332 | $119,900 | $7,300 | $112,600 |
| 2020 | $1,315 | $118,600 | $7,300 | $111,300 |
| 2019 | $1,231 | $113,800 | $7,300 | $106,500 |
| 2018 | $1,495 | $107,200 | $6,900 | $100,300 |
| 2017 | $1,507 | $108,900 | $6,900 | $102,000 |
| 2016 | $1,559 | $113,700 | $6,900 | $106,800 |
| 2014 | $3,209 | $137,100 | $8,600 | $128,500 |
| 2013 | $3,018 | $134,300 | $8,600 | $125,700 |
Source: Public Records
Map
Nearby Homes
- 568 Johnson St
- 600 Pierce St
- 733 Lincoln St
- 755 Johnson St
- 743 Buchanan St
- 800 Buchanan St
- 824 Johnson St
- 435 Buchanan St Unit 46402
- 851 Johnson St
- 434 Pierce St
- 408 Pierce St
- 833 Fillmore St
- 768 Tyler St
- 407 Polk St
- 329 Pierce St
- 302 Lincoln St
- 537 Harrison St
- 833 Tyler St
- 2006 W 4th Place
- 1695 W 10th Ave
- 581 Johnson St
- 575 Johnson St
- 1431 W 6th Ave
- 569 Johnson St
- 1516 W 6th Ave
- 600 Lincoln St
- 578 Lincoln St
- 578 Linconln St
- 580 Johnson St
- 1400 W 6th Ave
- 574 Johnson St
- 563 Johnson St
- 615 Johnson St
- 576 Lincoln St
- 600 Johnson St
- 620 Lincoln St
- 562 Lincoln St
- 557 Johnson St
- 625 Johnson St
- 608 Johnson St
Your Personal Tour Guide
Ask me questions while you tour the home.