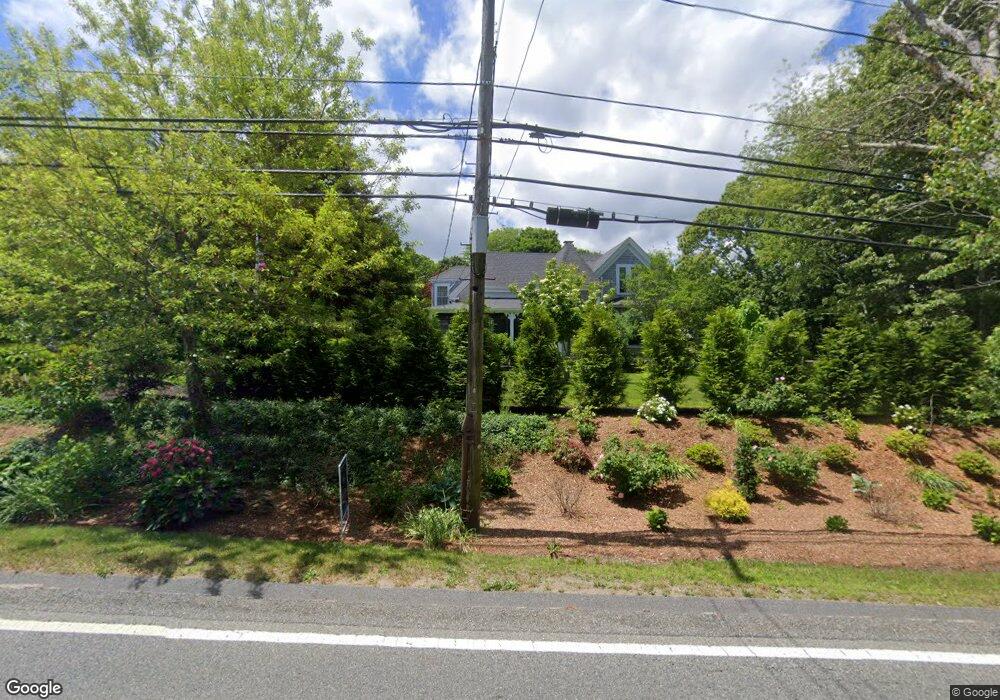
591 Main St West Barnstable, MA 02668
West Barnstable NeighborhoodEstimated Value: $1,098,000 - $1,340,000
5
Beds
6
Baths
3,865
Sq Ft
$309/Sq Ft
Est. Value
About This Home
This home is located at 591 Main St, West Barnstable, MA 02668 and is currently estimated at $1,196,148, approximately $309 per square foot. 591 Main St is a home located in Barnstable County with nearby schools including West Barnstable Elementary School, Barnstable United Elementary School, and Barnstable Intermediate School.
Ownership History
Date
Name
Owned For
Owner Type
Purchase Details
Closed on
Feb 6, 2023
Sold by
Finkenstaedt Catherine A
Bought by
C A Finkenstaedt Lt
Current Estimated Value
Purchase Details
Closed on
Jan 22, 2021
Sold by
Berkshire 1802 House Llc
Bought by
Finkenstaedt Catherine A
Home Financials for this Owner
Home Financials are based on the most recent Mortgage that was taken out on this home.
Original Mortgage
$376,000
Interest Rate
2.71%
Mortgage Type
Purchase Money Mortgage
Purchase Details
Closed on
Jul 6, 2011
Sold by
Ackerman Ruth V and Riley Fred
Bought by
Kowarek Richard J and Hunter-Young Nancy L
Home Financials for this Owner
Home Financials are based on the most recent Mortgage that was taken out on this home.
Original Mortgage
$500,000
Interest Rate
4.6%
Mortgage Type
Commercial
Purchase Details
Closed on
Apr 7, 2006
Sold by
Cotroneo Frank L and Riley Fred
Bought by
Riley Fred and Ackerman Ruth V
Home Financials for this Owner
Home Financials are based on the most recent Mortgage that was taken out on this home.
Original Mortgage
$920,000
Interest Rate
6.26%
Mortgage Type
Commercial
Purchase Details
Closed on
May 4, 2004
Sold by
Kilburn C William and Kilburn Mary G
Bought by
Cotroneo Frank L and Riley Fred
Home Financials for this Owner
Home Financials are based on the most recent Mortgage that was taken out on this home.
Original Mortgage
$197,800
Interest Rate
5.36%
Mortgage Type
Commercial
Create a Home Valuation Report for This Property
The Home Valuation Report is an in-depth analysis detailing your home's value as well as a comparison with similar homes in the area
Home Values in the Area
Average Home Value in this Area
Purchase History
| Date | Buyer | Sale Price | Title Company |
|---|---|---|---|
| C A Finkenstaedt Lt | -- | None Available | |
| Finkenstaedt Catherine A | $717,000 | None Available | |
| Kowarek Richard J | $625,000 | -- | |
| Riley Fred | -- | -- | |
| Cotroneo Frank L | $942,500 | -- |
Source: Public Records
Mortgage History
| Date | Status | Borrower | Loan Amount |
|---|---|---|---|
| Previous Owner | Finkenstaedt Catherine A | $376,000 | |
| Previous Owner | Kowarek Richard J | $500,000 | |
| Previous Owner | Riley Fred | $920,000 | |
| Previous Owner | Cotroneo Frank L | $197,800 |
Source: Public Records
Tax History
| Year | Tax Paid | Tax Assessment Tax Assessment Total Assessment is a certain percentage of the fair market value that is determined by local assessors to be the total taxable value of land and additions on the property. | Land | Improvement |
|---|---|---|---|---|
| 2025 | $11,530 | $1,234,500 | $306,800 | $927,700 |
| 2024 | $9,969 | $1,161,900 | $306,800 | $855,100 |
| 2023 | $9,358 | $1,027,200 | $304,200 | $723,000 |
| 2022 | $8,808 | $792,800 | $196,600 | $596,200 |
| 2021 | $7,633 | $651,300 | $206,000 | $445,300 |
| 2020 | $7,421 | $612,300 | $235,700 | $376,600 |
| 2019 | $7,679 | $625,300 | $248,700 | $376,600 |
| 2018 | $7,465 | $602,500 | $248,000 | $354,500 |
| 2017 | $7,394 | $604,100 | $254,900 | $349,200 |
| 2016 | $7,246 | $604,300 | $255,100 | $349,200 |
| 2015 | $7,775 | $650,100 | $244,700 | $405,400 |
Source: Public Records
Map
Nearby Homes
- 510 Cedar St
- 515 Cedar St
- 50 Wayside Ln
- 75 Old Toll Rd
- 282 Parker Rd
- 3 Mulberry Cir
- 6 Harpers Hollow
- 46 Service Rd
- 50 Currycomb Cir
- 159 Great Hill Rd
- 74 Saddler Ln
- 566 Route 6a
- 29 Fish House Rd
- 120 Great Hill Dr
- 0 Captain Kidd Rd
- 32 Willington Ave
- 1044 Old Falmouth Rd
- 1028 Old Falmouth Rd
- 62 Three Ponds Dr
- 68 Lakeside Dr
- 591 Old King's Hwy
- 591 Main St
- 573 Main St
- 0 Wisteria Ln
- 0 Wisteria Ln
- 590 Main St
- 590 Main St
- 597 Main St
- 621 Main St
- 620 Main St
- 597 Main St Rte 6a
- 24 Alderbrook Ln
- 551 Main St
- 40 Alderbrook Ln
- 56 Alderbrook Ln
- 600 Main St
- 1093 Massachusetts 6a
- 1 Main St
- 1190 Massachusetts 6a
- 1190 Massachusetts 6a