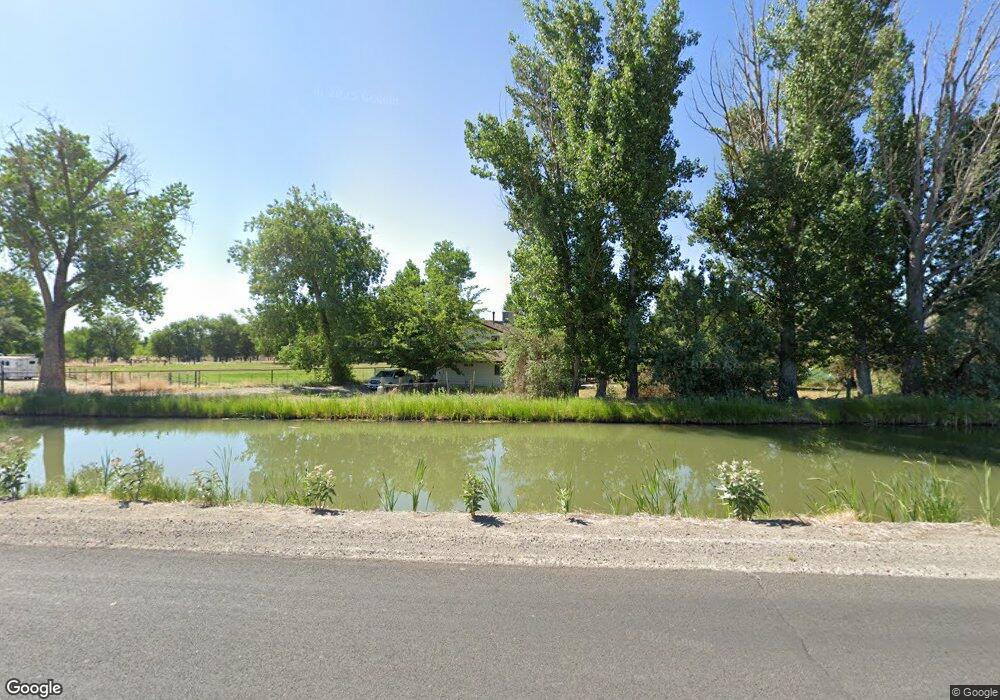
591 Regan Place Fallon, NV 89406
Estimated Value: $404,000 - $682,000
5
Beds
3
Baths
2,600
Sq Ft
$219/Sq Ft
Est. Value
About This Home
This home is located at 591 Regan Place, Fallon, NV 89406 and is currently estimated at $568,941, approximately $218 per square foot. 591 Regan Place is a home located in Churchill County with nearby schools including Lahontan Elementary School, E.C. Best Elementary School, and Numa Elementary School.
Ownership History
Date
Name
Owned For
Owner Type
Purchase Details
Closed on
Jul 14, 2022
Sold by
Roxanne Mcdermott
Bought by
Mcdermott Stephen and Mcdermott Roxanne
Current Estimated Value
Purchase Details
Closed on
Mar 23, 2016
Sold by
Mcdermott Roxanne and Lacometti Roxanne M
Bought by
Mcdermott Stephen and Mcdermott Roxanne
Home Financials for this Owner
Home Financials are based on the most recent Mortgage that was taken out on this home.
Original Mortgage
$205,930
Interest Rate
3.65%
Mortgage Type
New Conventional
Purchase Details
Closed on
Nov 3, 2011
Sold by
Baker Helen Jean
Bought by
Iacometti Roxanne M
Home Financials for this Owner
Home Financials are based on the most recent Mortgage that was taken out on this home.
Original Mortgage
$216,859
Interest Rate
4.4%
Mortgage Type
FHA
Create a Home Valuation Report for This Property
The Home Valuation Report is an in-depth analysis detailing your home's value as well as a comparison with similar homes in the area
Home Values in the Area
Average Home Value in this Area
Purchase History
| Date | Buyer | Sale Price | Title Company |
|---|---|---|---|
| Mcdermott Stephen | -- | None Listed On Document | |
| Mcdermott Stephen | -- | National Closing Solutions | |
| Iacometti Roxanne M | $222,500 | Western Nevada Title Company |
Source: Public Records
Mortgage History
| Date | Status | Borrower | Loan Amount |
|---|---|---|---|
| Previous Owner | Mcdermott Stephen | $205,930 | |
| Previous Owner | Iacometti Roxanne M | $216,859 |
Source: Public Records
Tax History Compared to Growth
Tax History
| Year | Tax Paid | Tax Assessment Tax Assessment Total Assessment is a certain percentage of the fair market value that is determined by local assessors to be the total taxable value of land and additions on the property. | Land | Improvement |
|---|---|---|---|---|
| 2025 | $3,373 | $122,381 | $39,769 | $82,612 |
| 2024 | $3,373 | $119,499 | $35,044 | $84,455 |
| 2023 | $3,373 | $113,649 | $35,044 | $78,605 |
| 2022 | $3,000 | $88,037 | $19,180 | $68,857 |
| 2021 | $2,955 | $86,514 | $19,180 | $67,334 |
| 2020 | $3,071 | $90,633 | $19,180 | $71,453 |
| 2019 | $2,925 | $89,050 | $19,180 | $69,870 |
| 2018 | $2,835 | $86,298 | $19,180 | $67,118 |
| 2017 | $2,763 | $87,248 | $19,180 | $68,068 |
| 2016 | $2,703 | $82,140 | $19,180 | $62,960 |
| 2015 | $2,658 | $78,583 | $19,180 | $59,403 |
| 2014 | $2,582 | $59,803 | $19,180 | $40,623 |
Source: Public Records
Map
Nearby Homes
- 1755 Coleman Rd
- 654 Sycamore Dr
- 1125 Alder Dr
- 1953 Verona Dr
- 929 Conifer Dr
- 431 Michael Dr
- 772 Megan Way
- 1044 Allen Rd
- 0000 Reno Hwy
- 411 Heron Ln
- 814 Kinsli St
- APN 007-091-75 Casey Rd
- APN 007-091-74 Casey Rd
- APN 007-091-73 Casey Rd
- APN 007-091-72 Casey Rd
- APN 007-091-71 Casey Rd
- APN 007-091-70 Casey Rd
- 410 Heron Ln
- 327 Burntwood St
- 714 Noel Ln
- 575 Regan Place
- 475 Regan Place
- 425 Regan Place
- 1955 Coleman Rd
- 385 Regan Place
- 385 Regan Place
- 385 Regan Place
- 355 Regan Place
- 2005 Coleman Rd
- 1765 Coleman Rd
- 2025 Coleman Rd
- 628 Peaceful Way
- 2105 Coleman Rd
- 660 Peaceful Way
- 642 Peaceful Way
- 2133 Coleman Rd Unit 1
- 750 Dallas Dr Unit Lot 72
- 2145 Coleman Rd
- 774 Sycamore Dr
- 726 Sycamore Dr