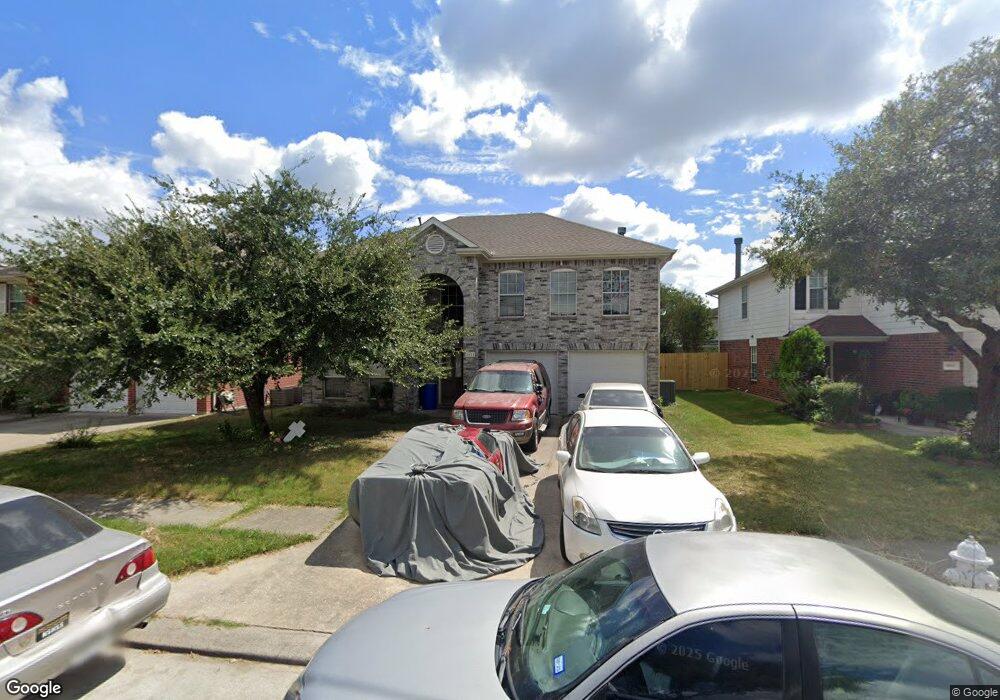
5911 Wickover Ln Houston, TX 77086
North Houston NeighborhoodEstimated Value: $263,539 - $292,000
4
Beds
3
Baths
2,444
Sq Ft
$113/Sq Ft
Est. Value
About This Home
This home is located at 5911 Wickover Ln, Houston, TX 77086 and is currently estimated at $276,635, approximately $113 per square foot. 5911 Wickover Ln is a home located in Harris County with nearby schools including Kujawa EC/Pre-K/K School, Shotwell Middle School, and Davis Ninth Grade.
Ownership History
Date
Name
Owned For
Owner Type
Purchase Details
Closed on
Jun 27, 2012
Sold by
Nguyen Linh Duy
Bought by
Deutsche Bank Trust Company Americas
Current Estimated Value
Purchase Details
Closed on
Feb 8, 2007
Sold by
Hud
Bought by
Nguyen Linh Duy
Home Financials for this Owner
Home Financials are based on the most recent Mortgage that was taken out on this home.
Original Mortgage
$105,355
Interest Rate
6.13%
Mortgage Type
Purchase Money Mortgage
Purchase Details
Closed on
Jun 13, 2006
Sold by
Wells Fargo Bank Na
Bought by
Hud
Purchase Details
Closed on
Jun 6, 2006
Sold by
Mcgregor Lawrence O and Mcgregor Tarrish
Bought by
Wells Fargo Bank Na
Purchase Details
Closed on
Apr 22, 2002
Sold by
Kb Home Loan Star Lp
Bought by
Mcgregor Lawrence O
Home Financials for this Owner
Home Financials are based on the most recent Mortgage that was taken out on this home.
Original Mortgage
$130,341
Interest Rate
7.11%
Mortgage Type
FHA
Create a Home Valuation Report for This Property
The Home Valuation Report is an in-depth analysis detailing your home's value as well as a comparison with similar homes in the area
Home Values in the Area
Average Home Value in this Area
Purchase History
| Date | Buyer | Sale Price | Title Company |
|---|---|---|---|
| Deutsche Bank Trust Company Americas | $79,200 | None Available | |
| Nguyen Linh Duy | -- | Etc | |
| Hud | -- | None Available | |
| Wells Fargo Bank Na | $145,339 | None Available | |
| Mcgregor Lawrence O | -- | First American Title |
Source: Public Records
Mortgage History
| Date | Status | Borrower | Loan Amount |
|---|---|---|---|
| Previous Owner | Nguyen Linh Duy | $105,355 | |
| Previous Owner | Mcgregor Lawrence O | $130,341 |
Source: Public Records
Tax History
| Year | Tax Paid | Tax Assessment Tax Assessment Total Assessment is a certain percentage of the fair market value that is determined by local assessors to be the total taxable value of land and additions on the property. | Land | Improvement |
|---|---|---|---|---|
| 2025 | $5,777 | $278,391 | $33,313 | $245,078 |
| 2024 | $5,777 | $249,778 | $33,313 | $216,465 |
| 2023 | $5,777 | $257,356 | $34,125 | $223,231 |
| 2022 | $5,669 | $232,900 | $26,250 | $206,650 |
| 2021 | $4,222 | $173,878 | $26,250 | $147,628 |
| 2020 | $4,623 | $171,246 | $26,250 | $144,996 |
| 2019 | $4,738 | $168,800 | $18,375 | $150,425 |
| 2018 | $2,125 | $148,000 | $18,375 | $129,625 |
| 2017 | $4,005 | $148,000 | $18,375 | $129,625 |
| 2016 | $3,654 | $135,000 | $18,375 | $116,625 |
| 2015 | $2,781 | $130,140 | $18,375 | $111,765 |
| 2014 | $2,781 | $108,714 | $18,375 | $90,339 |
Source: Public Records
Map
Nearby Homes
- 6307 Sutton Meadows Dr
- 00 Essie Rd
- 6411 Halstead Meadows Cir
- 10730 Antoine Dr
- 12623 Ann Louise Rd
- 00 Romona Blvd
- 3265 Frick Rd
- 6622 Sutton Meadows Dr
- 5930 Killough St
- 5407 Chippewa Blvd
- 13410 Ann Louise Rd
- 6011 Killough St
- 3127 Frick Rd
- 6615 Deer Ridge Ln
- 10214 Trade Winds Dr
- 0 Tomball Pkwy
- 6606 Dusty Dawn Dr
- 12026 Madison Oak St
- 2934 Valiant Scene Ct
- 12006 Mallard Stream Ct
- 5907 Wickover Ln
- 5915 Wickover Ln
- 5903 Wickover Ln
- 5919 Wickover Ln
- 5914 Logancrest Ln
- 5918 Logancrest Ln
- 5910 Logancrest Ln
- 5835 Wickover Ln
- 5923 Wickover Ln
- 5910 Wickover Ln
- 5906 Wickover Ln
- 5914 Wickover Ln
- 5906 Logancrest Ln
- 5902 Wickover Ln
- 5918 Wickover Ln
- 5831 Wickover Ln
- 5834 Wickover Ln
- 5922 Wickover Ln
- 5827 Wickover Ln
- 5830 Wickover Ln