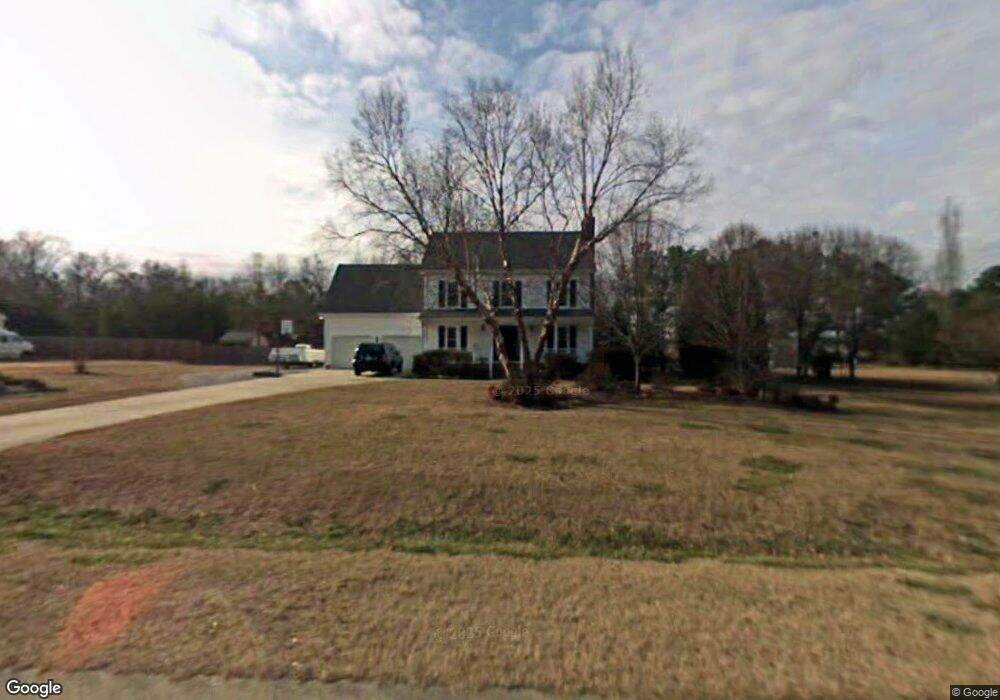
5912 Hampton Ridge Rd Raleigh, NC 27603
South Raleigh NeighborhoodEstimated Value: $420,000 - $453,000
3
Beds
3
Baths
2,138
Sq Ft
$206/Sq Ft
Est. Value
About This Home
This home is located at 5912 Hampton Ridge Rd, Raleigh, NC 27603 and is currently estimated at $439,417, approximately $205 per square foot. 5912 Hampton Ridge Rd is a home located in Wake County with nearby schools including Rand Road Elementary, North Garner Middle, and Garner High.
Ownership History
Date
Name
Owned For
Owner Type
Purchase Details
Closed on
Sep 12, 2017
Sold by
Dialey Alonzo C and Dialey Sheilfa J
Bought by
Smith Brian D and Smith Stephanie D
Current Estimated Value
Home Financials for this Owner
Home Financials are based on the most recent Mortgage that was taken out on this home.
Original Mortgage
$218,200
Outstanding Balance
$182,016
Interest Rate
3.86%
Mortgage Type
New Conventional
Estimated Equity
$257,401
Purchase Details
Closed on
Sep 4, 2009
Sold by
Gore Brent and Gore Julie
Bought by
Dailey Alonzo C and Dailey Shelia J
Home Financials for this Owner
Home Financials are based on the most recent Mortgage that was taken out on this home.
Original Mortgage
$120,000
Interest Rate
5.14%
Mortgage Type
New Conventional
Purchase Details
Closed on
Mar 28, 2001
Sold by
Varnell Marcus K
Bought by
Gore Brent and Gore Julie
Home Financials for this Owner
Home Financials are based on the most recent Mortgage that was taken out on this home.
Original Mortgage
$148,000
Interest Rate
6.37%
Create a Home Valuation Report for This Property
The Home Valuation Report is an in-depth analysis detailing your home's value as well as a comparison with similar homes in the area
Home Values in the Area
Average Home Value in this Area
Purchase History
| Date | Buyer | Sale Price | Title Company |
|---|---|---|---|
| Smith Brian D | $242,500 | None Available | |
| Dailey Alonzo C | $220,000 | None Available | |
| Gore Brent | $185,000 | -- |
Source: Public Records
Mortgage History
| Date | Status | Borrower | Loan Amount |
|---|---|---|---|
| Open | Smith Brian D | $218,200 | |
| Previous Owner | Dailey Alonzo C | $120,000 | |
| Previous Owner | Gore Brent | $148,000 |
Source: Public Records
Tax History
| Year | Tax Paid | Tax Assessment Tax Assessment Total Assessment is a certain percentage of the fair market value that is determined by local assessors to be the total taxable value of land and additions on the property. | Land | Improvement |
|---|---|---|---|---|
| 2025 | $2,732 | $424,070 | $80,000 | $344,070 |
| 2024 | $2,653 | $424,070 | $80,000 | $344,070 |
Source: Public Records
Map
Nearby Homes
- 5864 Carriage Gate Dr
- 6104 Wolverhampton Dr
- 5824 Carriage Gate Dr
- 5904 Cir
- 1245 Azalea Garden Cir
- 1320 Greenbranch Ln
- 1020 Azalea Garden Cir
- 1200 Kinleywood Ct
- 1233 Azalea Garden Cir
- 1025 Azalea Garden Cir
- 1024 Azalea Garden Cir
- 1028 Azalea Garden Cir
- 1217 Azalea Garden Cir
- 1005 Turner Meadow Dr
- 1057 Azalea Garden Cir
- 1061 Azalea Garden Cir
- 1409 Porchlight Ct
- 1060 Azalea Garden Cir
- 1065 Azalea Garden Cir
- 1069 Azalea Garden Cir
- 5908 Hampton Ridge Rd
- 5916 Hampton Ridge Rd
- 1620 Habbot Dr
- 5904 Hampton Ridge Rd
- 1613 Habbot Dr
- 1616 Habbot Dr
- 5924 Hampton Ridge Rd
- 5921 Hampton Ridge Rd
- 1617 Spennymore Rd
- 5900 Hampton Ridge Rd
- 1612 Habbot Dr
- 1613 Spennymore Rd
- 5925 Hampton Ridge Rd
- 5928 Hampton Ridge Rd
- 1609 Spennymore Rd
- 1609 Habbot Dr
- 1608 Habbot Dr
- 5929 Hampton Ridge Rd
- 1605 Spennymore Rd
- 5820 Hampton Ridge Rd
Your Personal Tour Guide
Ask me questions while you tour the home.