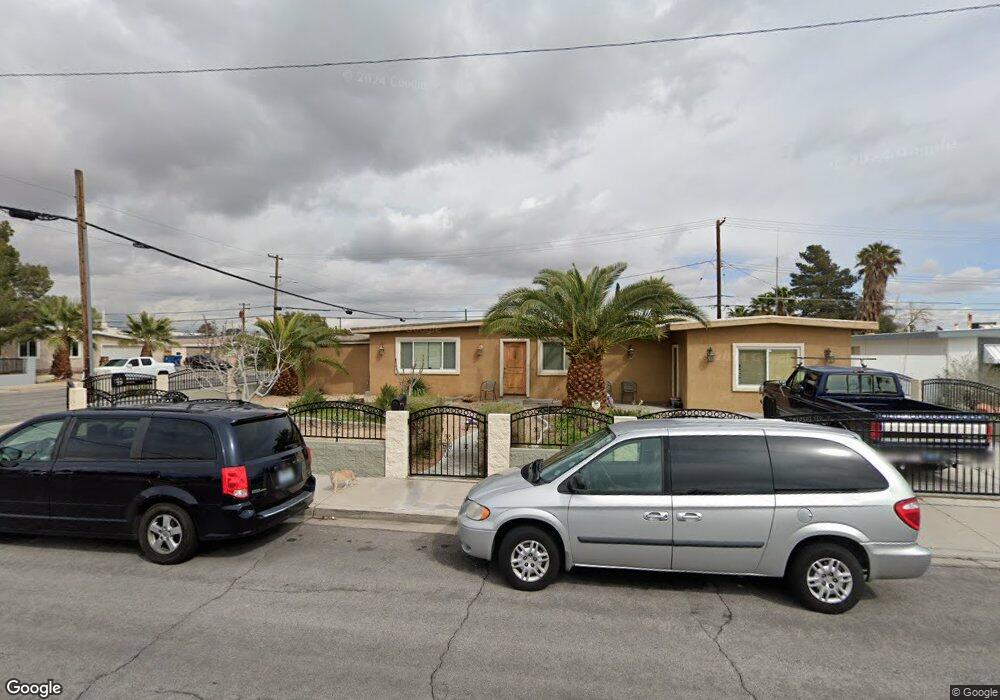
5912 Heron Ave Unit 1 Las Vegas, NV 89107
Buffalo NeighborhoodEstimated Value: $390,000 - $419,000
3
Beds
2
Baths
1,594
Sq Ft
$251/Sq Ft
Est. Value
About This Home
This home is located at 5912 Heron Ave Unit 1, Las Vegas, NV 89107 and is currently estimated at $400,837, approximately $251 per square foot. 5912 Heron Ave Unit 1 is a home located in Clark County with nearby schools including Red Rock Elementary School, Frank F Garside Junior High School, and Western High School.
Ownership History
Date
Name
Owned For
Owner Type
Purchase Details
Closed on
Sep 17, 2020
Sold by
Patenaude Elaine and Poirier Jeffrey
Bought by
Nagez Igor
Current Estimated Value
Purchase Details
Closed on
Mar 29, 2011
Sold by
U S Bank N A
Bought by
Poirier Jeffrey
Purchase Details
Closed on
Aug 10, 2010
Sold by
Zelaya Ana
Bought by
U S Bank Na
Purchase Details
Closed on
Aug 15, 2005
Sold by
Zargari Kamyar
Bought by
Zelaya Ana
Home Financials for this Owner
Home Financials are based on the most recent Mortgage that was taken out on this home.
Original Mortgage
$225,000
Interest Rate
8.5%
Mortgage Type
Unknown
Purchase Details
Closed on
Feb 3, 2005
Sold by
Kendrick Maribeth and Kendrick Bruce A
Bought by
Zargari Kamyar
Home Financials for this Owner
Home Financials are based on the most recent Mortgage that was taken out on this home.
Original Mortgage
$152,400
Interest Rate
8.25%
Mortgage Type
Unknown
Create a Home Valuation Report for This Property
The Home Valuation Report is an in-depth analysis detailing your home's value as well as a comparison with similar homes in the area
Home Values in the Area
Average Home Value in this Area
Purchase History
| Date | Buyer | Sale Price | Title Company |
|---|---|---|---|
| Nagez Igor | $121,857 | None Available | |
| Poirier Jeffrey | $59,100 | Pta Title Nv | |
| U S Bank Na | $60,000 | Accommodation | |
| Zelaya Ana | $250,000 | Equity Title Of Nevada | |
| Zargari Kamyar | $190,500 | Equity Title Of Nevada |
Source: Public Records
Mortgage History
| Date | Status | Borrower | Loan Amount |
|---|---|---|---|
| Previous Owner | Zelaya Ana | $225,000 | |
| Previous Owner | Zargari Kamyar | $152,400 | |
| Closed | Zargari Kamyar | $19,050 |
Source: Public Records
Tax History Compared to Growth
Tax History
| Year | Tax Paid | Tax Assessment Tax Assessment Total Assessment is a certain percentage of the fair market value that is determined by local assessors to be the total taxable value of land and additions on the property. | Land | Improvement |
|---|---|---|---|---|
| 2025 | $1,115 | $61,249 | $33,950 | $27,299 |
| 2024 | $1,083 | $61,249 | $33,950 | $27,299 |
| 2023 | $1,083 | $55,669 | $31,150 | $24,519 |
| 2022 | $1,051 | $46,856 | $24,850 | $22,006 |
| 2021 | $1,067 | $43,550 | $23,100 | $20,450 |
| 2020 | $988 | $42,648 | $22,750 | $19,898 |
| 2019 | $926 | $38,072 | $18,900 | $19,172 |
| 2018 | $884 | $34,154 | $16,100 | $18,054 |
| 2017 | $1,059 | $32,306 | $14,350 | $17,956 |
| 2016 | $828 | $28,791 | $11,550 | $17,241 |
| 2015 | $825 | $26,280 | $8,750 | $17,530 |
| 2014 | $801 | $23,719 | $5,600 | $18,119 |
Source: Public Records
Map
Nearby Homes
- 6100 Alamo Cir
- 5705 Evergreen Ave
- 6120 Cairo Cir
- 709 Evergreen Cir
- 5613 Idle Ave
- 6108 Kimberly Cir
- 800 Antonio Dr
- 809 Upland Blvd
- 332 S Mallard St
- 417 Wisteria Ave
- 360 Wisteria Ave
- 329 Wisteria Ave
- 309 Wisteria Ave
- 824 Salem Dr
- 5425 Evergreen Ave
- 6204 W Charleston Blvd
- 6164 Cromwell Ave
- 340 Zion Dr
- 6225 Arlington Ave
- 5326 Evergreen Ave
- 5908 Heron Ave
- 5925 Gipsy Ave
- 5921 Gipsy Ave
- 5904 Heron Ave
- 5913 Heron Ave
- 529 S Mallard St
- 525 S Mallard St Unit 2
- 5917 Gipsy Ave
- 5909 Heron Ave
- 601 S Mallard St
- 521 S Mallard St
- 5905 Heron Ave
- 5913 Gipsy Ave
- 5900 Heron Ave
- 517 S Mallard St
- 605 S Mallard St
- 5912 Idle Ave
- 5924 Gipsy Ave
- 5920 Gipsy Ave
- 5908 Idle Ave