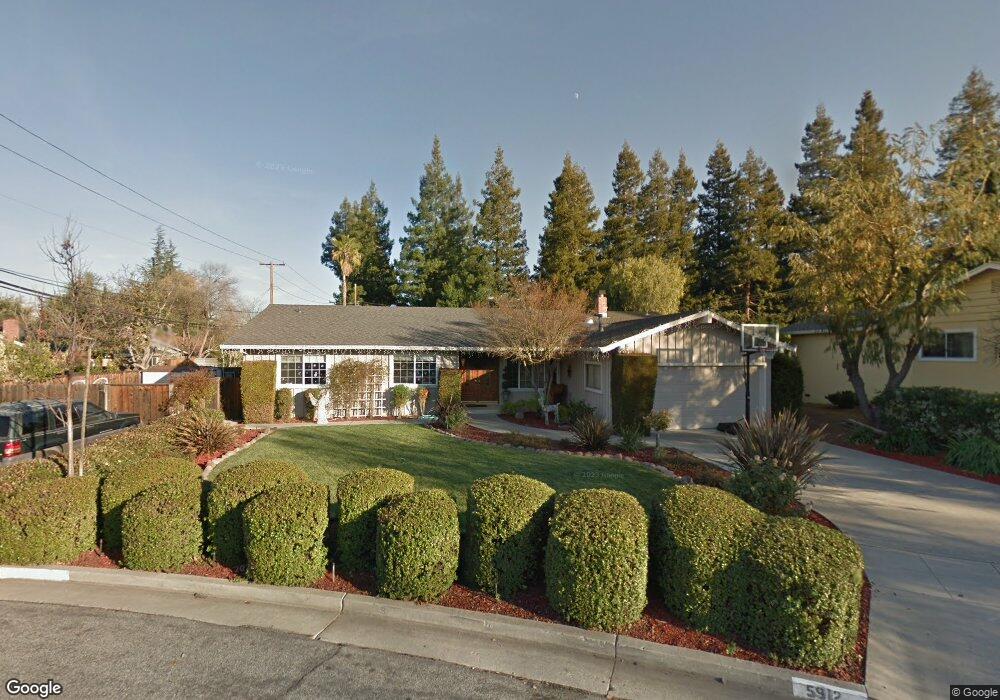
5912 Hosta Ln San Jose, CA 95124
De Voss-Leigh NeighborhoodEstimated Value: $2,609,000 - $2,956,067
3
Beds
3
Baths
1,643
Sq Ft
$1,662/Sq Ft
Est. Value
About This Home
This home is located at 5912 Hosta Ln, San Jose, CA 95124 and is currently estimated at $2,731,267, approximately $1,662 per square foot. 5912 Hosta Ln is a home located in Santa Clara County with nearby schools including Guadalupe Elementary School, Dartmouth Middle School, and Leigh High School.
Ownership History
Date
Name
Owned For
Owner Type
Purchase Details
Closed on
Nov 19, 2015
Sold by
Mccarroll Ingrid Lynn
Bought by
Mccarroll Ingrid Lynn
Current Estimated Value
Purchase Details
Closed on
Apr 26, 2002
Sold by
Mccarroll Kevin A and Mccarroll Ingrid Lynn
Bought by
Mccarroll Kevin A and Mccarroll Ingrid Lynn
Home Financials for this Owner
Home Financials are based on the most recent Mortgage that was taken out on this home.
Original Mortgage
$110,000
Interest Rate
7.18%
Mortgage Type
Credit Line Revolving
Purchase Details
Closed on
Nov 20, 1999
Sold by
Albrecht Ingrid L and Lynn Ingrid
Bought by
Mccarroll Kevin A and Mccarroll Ingrid Lynn
Purchase Details
Closed on
May 14, 1997
Sold by
Sharon Spriggs
Bought by
Albrecht Ingrid L
Home Financials for this Owner
Home Financials are based on the most recent Mortgage that was taken out on this home.
Original Mortgage
$230,000
Outstanding Balance
$30,470
Interest Rate
7.62%
Estimated Equity
$2,700,797
Create a Home Valuation Report for This Property
The Home Valuation Report is an in-depth analysis detailing your home's value as well as a comparison with similar homes in the area
Home Values in the Area
Average Home Value in this Area
Purchase History
| Date | Buyer | Sale Price | Title Company |
|---|---|---|---|
| Mccarroll Ingrid Lynn | -- | None Available | |
| Mccarroll Kevin A | -- | North American Title Co | |
| Mccarroll Kevin A | -- | North American Title Co | |
| Mccarroll Kevin A | -- | -- | |
| Albrecht Ingrid L | $360,000 | Fidelity National Title Co |
Source: Public Records
Mortgage History
| Date | Status | Borrower | Loan Amount |
|---|---|---|---|
| Closed | Mccarroll Kevin A | $110,000 | |
| Open | Albrecht Ingrid L | $230,000 |
Source: Public Records
Tax History
| Year | Tax Paid | Tax Assessment Tax Assessment Total Assessment is a certain percentage of the fair market value that is determined by local assessors to be the total taxable value of land and additions on the property. | Land | Improvement |
|---|---|---|---|---|
| 2025 | $10,336 | $710,634 | $231,264 | $479,370 |
| 2024 | $10,336 | $696,701 | $226,730 | $469,971 |
| 2023 | $10,111 | $683,041 | $222,285 | $460,756 |
| 2022 | $9,910 | $669,649 | $217,927 | $451,722 |
| 2021 | $9,696 | $656,519 | $213,654 | $442,865 |
| 2020 | $9,479 | $649,788 | $211,464 | $438,324 |
| 2019 | $9,304 | $637,048 | $207,318 | $429,730 |
| 2018 | $9,072 | $624,557 | $203,253 | $421,304 |
| 2017 | $8,950 | $612,312 | $199,268 | $413,044 |
| 2016 | $8,532 | $600,307 | $195,361 | $404,946 |
| 2015 | $8,393 | $591,291 | $192,427 | $398,864 |
| 2014 | $7,849 | $579,709 | $188,658 | $391,051 |
Source: Public Records
Map
Nearby Homes
- 1685 Zinnia Ln
- 1516 Ivan Place
- 114 Gemini Ct
- 1574 Guadalajara Dr
- 1666 Blossom Hill Rd
- 530 Santa Rosa Dr
- 1705 Blossom Hill Rd
- 1714 Via Cortina
- 5451 Lauren Dr
- 1855 Sycamore Creek
- 1769 Gilda Way
- 267 Belvue Dr
- 1544 Bouchard Dr
- 1459 Nesbit Ct
- 311 Santa Rosa Dr
- 151 Old Orchard Dr
- 0000 Harwood Rd
- 5805 Chambertin Dr
- 5524 Harvard Dr
- 1532 Kooser Rd
- 5924 Hosta Ln
- 1648 Hyacinth Ln
- 1646 Hyacinth Ln
- 1644 Hyacinth Ln
- 5934 Hosta Ln
- 1652 Hyacinth Ln
- 6091 Calle de Amor Unit A
- 6097 Calle de Amor
- 6095 Calle de Amor
- 6093 Calle de Amor
- 6091 Calle de Amor
- 6089 Calle de Amor Unit 79
- 1642 Hyacinth Ln
- 6099 Calle de Amor
- 5944 Hosta Ln
- 5913 Hosta Ln
- 1638 Hyacinth Ln
- 1654 Hyacinth Ln
- 6081 Calle de Amor Unit 76
- 6079 Calle de Amor
Your Personal Tour Guide
Ask me questions while you tour the home.