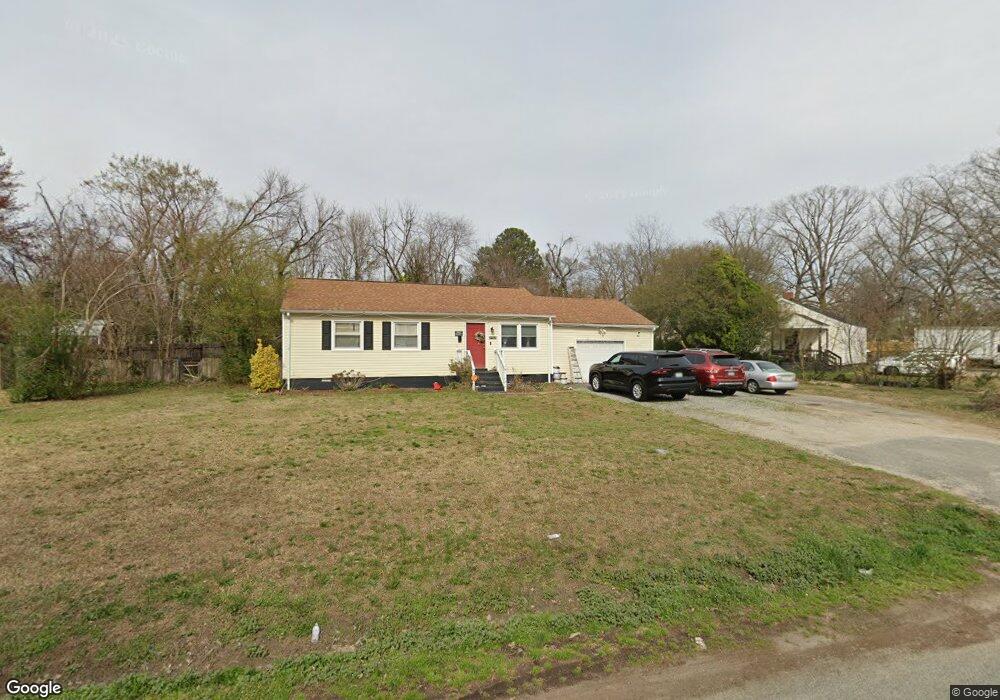
5912 Wainwright Dr Richmond, VA 23225
Westover NeighborhoodEstimated Value: $280,000 - $286,000
3
Beds
2
Baths
943
Sq Ft
$301/Sq Ft
Est. Value
About This Home
This home is located at 5912 Wainwright Dr, Richmond, VA 23225 and is currently estimated at $284,002, approximately $301 per square foot. 5912 Wainwright Dr is a home located in Richmond City with nearby schools including Elizabeth D. Redd Elementary School, Lucille M. Brown Middle, and Huguenot High School.
Ownership History
Date
Name
Owned For
Owner Type
Purchase Details
Closed on
Feb 24, 2016
Sold by
Gonzalez Luis M and Gonzalez Itza N
Bought by
Gonzalez Luis M and Gonzalez Itza N
Current Estimated Value
Purchase Details
Closed on
Mar 5, 2010
Sold by
Virginia Housing Development
Bought by
Gonzalez Luis M
Purchase Details
Closed on
Sep 3, 2009
Sold by
Evans And Bryant Plc
Bought by
Virginia Housing Development
Purchase Details
Closed on
Oct 20, 2006
Sold by
Gosselin Bradley
Bought by
Agee Ellen
Home Financials for this Owner
Home Financials are based on the most recent Mortgage that was taken out on this home.
Original Mortgage
$126,500
Interest Rate
6.31%
Mortgage Type
New Conventional
Purchase Details
Closed on
Feb 2, 2006
Sold by
Ashford Suzanne C
Bought by
Gosselin Bradley J
Home Financials for this Owner
Home Financials are based on the most recent Mortgage that was taken out on this home.
Original Mortgage
$114,098
Interest Rate
6.28%
Mortgage Type
FHA
Create a Home Valuation Report for This Property
The Home Valuation Report is an in-depth analysis detailing your home's value as well as a comparison with similar homes in the area
Home Values in the Area
Average Home Value in this Area
Purchase History
| Date | Buyer | Sale Price | Title Company |
|---|---|---|---|
| Gonzalez Luis M | -- | None Available | |
| Gonzalez Luis M | $70,000 | -- | |
| Virginia Housing Development | $82,000 | -- | |
| Agee Ellen | $126,500 | -- | |
| Gosselin Bradley J | $115,000 | -- |
Source: Public Records
Mortgage History
| Date | Status | Borrower | Loan Amount |
|---|---|---|---|
| Previous Owner | Agee Ellen | $126,500 | |
| Previous Owner | Gosselin Bradley J | $114,098 |
Source: Public Records
Tax History
| Year | Tax Paid | Tax Assessment Tax Assessment Total Assessment is a certain percentage of the fair market value that is determined by local assessors to be the total taxable value of land and additions on the property. | Land | Improvement |
|---|---|---|---|---|
| 2025 | $2,544 | $229,000 | $51,000 | $178,000 |
| 2024 | $2,544 | $212,000 | $44,000 | $168,000 |
| 2023 | $2,544 | $212,000 | $44,000 | $168,000 |
| 2022 | $2,220 | $185,000 | $44,000 | $141,000 |
| 2020 | $1,632 | $136,000 | $30,000 | $106,000 |
| 2019 | $1,500 | $125,000 | $30,000 | $95,000 |
| 2018 | $1,440 | $120,000 | $25,000 | $95,000 |
| 2017 | $1,356 | $113,000 | $25,000 | $88,000 |
| 2016 | $1,356 | $113,000 | $25,000 | $88,000 |
| 2015 | $1,368 | $117,000 | $25,000 | $92,000 |
| 2014 | $1,368 | $114,000 | $26,000 | $88,000 |
Source: Public Records
Map
Nearby Homes
- 5607 Jahnke Rd
- 5618 Larrymore Rd
- 514 German School Rd
- 6119 Primrose Place
- 6117 Primrose Place
- 5606 Southern Pine Dr
- 501 Faye St
- 6206 Lamar Dr
- 1408 Boroughbridge Rd
- 1164 Grand Brook Dr
- 406 Beaufont Hills Dr
- 719 W 49th St
- 1669 Bilder Ct
- 5636 Forest Hill Ave
- 1007 W 48th St
- 59 Rodman Rd
- 5411 Dorchester Rd
- 1234 Boulder Creek Rd
- 610 Queen Anne Dr
- 831 Green Ridge Dr
- 5900 Wainwright Dr
- 5922 Wainwright Dr
- 5928 Wainwright Dr
- 5913 Wainwright Dr
- 912 Halsey Ln
- 5919 Wainwright Dr
- 5907 Wainwright Dr
- 924 Halsey Ln
- 5925 Wainwright Dr
- 5901 Wainwright Dr
- 5934 Wainwright Dr
- 5813 Wainwright Dr
- 5931 Wainwright Dr
- 930 Halsey Ln
- 5940 Wainwright Dr
- 5807 Wainwright Dr
- 5937 Wainwright Dr
- 936 Halsey Ln
- 5801 Wainwright Dr
- 5946 Wainwright Dr
Your Personal Tour Guide
Ask me questions while you tour the home.