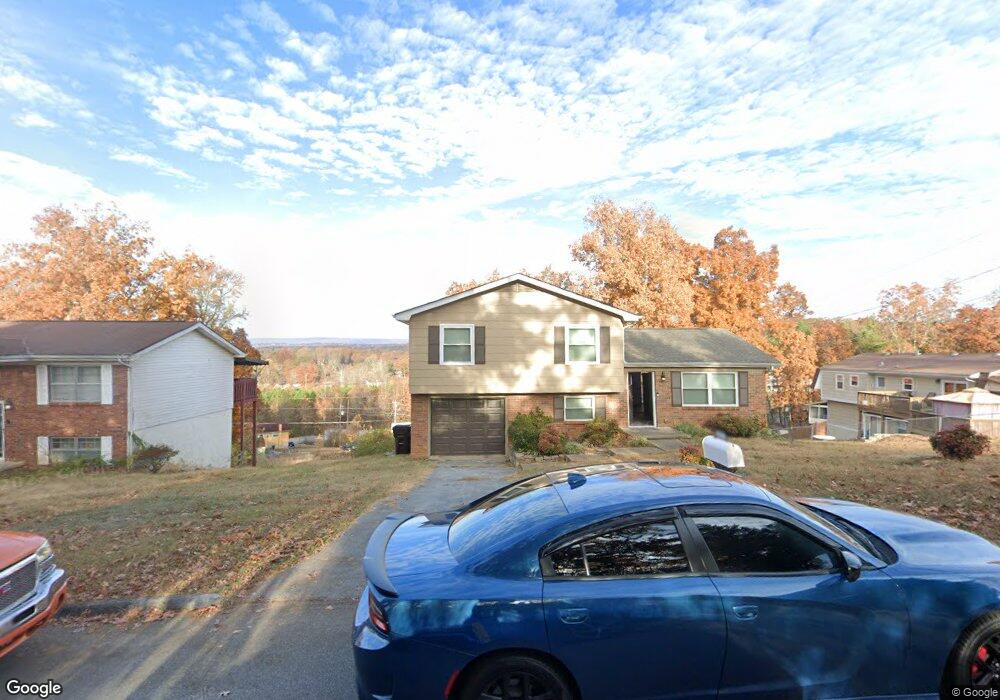
5913 Gettysburg Dr Harrison, TN 37341
Estimated Value: $259,000 - $289,000
Studio
1
Bath
1,082
Sq Ft
$257/Sq Ft
Est. Value
About This Home
This home is located at 5913 Gettysburg Dr, Harrison, TN 37341 and is currently estimated at $277,656, approximately $256 per square foot. 5913 Gettysburg Dr is a home located in Hamilton County with nearby schools including Harrison Elementary School, Brown Middle School, and Central High School.
Ownership History
Date
Name
Owned For
Owner Type
Purchase Details
Closed on
Sep 18, 2023
Sold by
Barrott Dakin
Bought by
Whitaker Sayvion
Current Estimated Value
Home Financials for this Owner
Home Financials are based on the most recent Mortgage that was taken out on this home.
Original Mortgage
$6,000
Outstanding Balance
$433
Interest Rate
6.9%
Mortgage Type
New Conventional
Estimated Equity
$277,223
Purchase Details
Closed on
Feb 22, 2019
Sold by
Tatum Scott
Bought by
Barrott Dakin
Home Financials for this Owner
Home Financials are based on the most recent Mortgage that was taken out on this home.
Original Mortgage
$120,650
Interest Rate
4.4%
Mortgage Type
FHA
Purchase Details
Closed on
Feb 21, 2018
Sold by
Thomas Sr Cleveland William and Thomas Jr Cleveland William
Bought by
Tatum Scott
Purchase Details
Closed on
Jun 12, 2015
Sold by
Davis Ann D
Bought by
Thomas Sr Cleveland William and Thomas Jr Cleveland William
Create a Home Valuation Report for This Property
The Home Valuation Report is an in-depth analysis detailing your home's value as well as a comparison with similar homes in the area
Home Values in the Area
Average Home Value in this Area
Purchase History
| Date | Buyer | Sale Price | Title Company |
|---|---|---|---|
| Whitaker Sayvion | $260,000 | Bridge City Title | |
| Barrott Dakin | $139,500 | Foundation Title & Escrow Ch | |
| Tatum Scott | $98,000 | Foundation Title & Escrow Ll | |
| Thomas Sr Cleveland William | $28,000 | First Title |
Source: Public Records
Mortgage History
| Date | Status | Borrower | Loan Amount |
|---|---|---|---|
| Open | Whitaker Sayvion | $6,000 | |
| Open | Whitaker Sayvion | $255,290 | |
| Previous Owner | Barrott Dakin | $120,650 |
Source: Public Records
Tax History
| Year | Tax Paid | Tax Assessment Tax Assessment Total Assessment is a certain percentage of the fair market value that is determined by local assessors to be the total taxable value of land and additions on the property. | Land | Improvement |
|---|---|---|---|---|
| 2025 | $1,038 | $68,450 | $0 | $0 |
| 2024 | $816 | $36,475 | $0 | $0 |
| 2023 | $825 | $36,475 | $0 | $0 |
| 2022 | $825 | $36,475 | $0 | $0 |
| 2021 | $825 | $36,475 | $0 | $0 |
| 2020 | $709 | $25,300 | $0 | $0 |
| 2019 | $709 | $25,300 | $0 | $0 |
| 2018 | $709 | $25,300 | $0 | $0 |
| 2017 | $709 | $25,300 | $0 | $0 |
| 2016 | $608 | $0 | $0 | $0 |
| 2015 | $608 | $21,650 | $0 | $0 |
| 2014 | $608 | $0 | $0 | $0 |
Source: Public Records
Map
Nearby Homes
- 6915 Sentinel Ln
- 5958 Congress Ln
- 6039 Porter Dr
- 6117 Pythian Rd
- 5900 Tyner Ln
- 5902 Tyner Ln
- 7004 Lystra Rd
- 7015 Lystra Rd
- 6422 Mill Stream Dr
- 7004 Sleigh Ln
- 6831 Knollcrest Dr
- 7010 Barleyfield Dr
- 6638 Sandwood Cir
- 6920 Knollcrest Dr
- 9223 Sunny Shore Ln
- 6421 Fairest Dr
- 9113 Edgewater Rd
- 7115 Snapdragon Ln
- 6591 Chipmunk Dr
- 7050 Luke Ln
- 5917 Gettysburg Dr Unit 1
- 5917 Gettysburg Dr
- 5900 Doe Run Ln
- 5911 Gettysburg Dr
- 5909 Gettysburg Dr
- 6910 Sentinel Ln
- 5901 Doe Run Ln
- 5902 Doe Run Ln
- 5912 Gettysburg Dr
- 5907 Gettysburg Dr
- 5988 Congress Ln
- 5910 Gettysburg Dr
- 5986 Congress Ln
- 6909 Sentinel Ln
- 5903 Doe Run Ln
- 5984 Congress Ln Unit 2
- 6912 Sentinel Ln
- 5908 Gettysburg Dr
- 5905 Gettysburg Dr
- 5904 Doe Run Ln
Your Personal Tour Guide
Ask me questions while you tour the home.