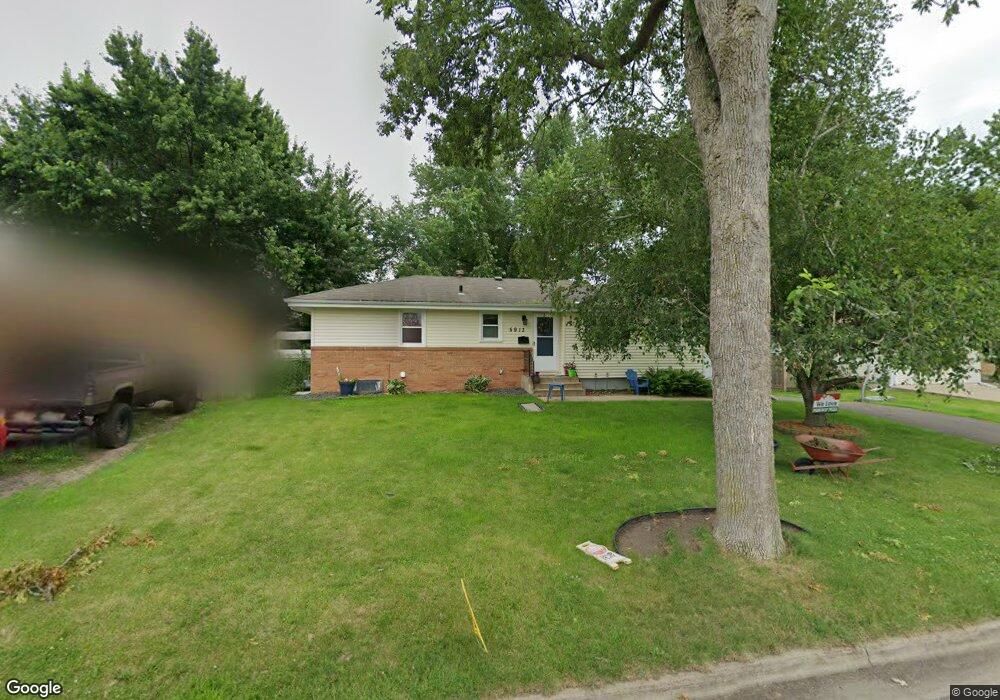
5913 W 25 1/2 St Saint Louis Park, MN 55416
Birchwood NeighborhoodEstimated Value: $400,441 - $441,000
3
Beds
1
Bath
1,122
Sq Ft
$372/Sq Ft
Est. Value
About This Home
This home is located at 5913 W 25 1/2 St, Saint Louis Park, MN 55416 and is currently estimated at $417,860, approximately $372 per square foot. 5913 W 25 1/2 St is a home located in Hennepin County with nearby schools including Peter Hobart Elementary School, St. Louis Park Middle School, and St. Louis Park High School.
Ownership History
Date
Name
Owned For
Owner Type
Purchase Details
Closed on
Feb 1, 2021
Sold by
Kirkpatrick James Allen
Bought by
Kirkpatrick Myria
Current Estimated Value
Purchase Details
Closed on
Oct 26, 2017
Sold by
Kirkpatrick Myria
Bought by
Kirkpatrick James Allen and Kirkpatrick Myria
Home Financials for this Owner
Home Financials are based on the most recent Mortgage that was taken out on this home.
Original Mortgage
$198,000
Outstanding Balance
$165,827
Interest Rate
3.83%
Mortgage Type
New Conventional
Estimated Equity
$252,033
Purchase Details
Closed on
Feb 7, 2012
Sold by
Kirkpatrick Myria and Kirkpatrick James
Bought by
Kirkpatrick Myria
Home Financials for this Owner
Home Financials are based on the most recent Mortgage that was taken out on this home.
Original Mortgage
$201,572
Interest Rate
3.75%
Mortgage Type
FHA
Purchase Details
Closed on
Nov 13, 2009
Sold by
Walder Doris
Bought by
Mckobertz Myra
Create a Home Valuation Report for This Property
The Home Valuation Report is an in-depth analysis detailing your home's value as well as a comparison with similar homes in the area
Home Values in the Area
Average Home Value in this Area
Purchase History
| Date | Buyer | Sale Price | Title Company |
|---|---|---|---|
| Kirkpatrick Myria | -- | All American Title Co Inc | |
| Kirkpatrick James Allen | -- | None Available | |
| Kirkpatrick Myria | -- | Transtar National Title | |
| Mckobertz Myra | $209,000 | -- |
Source: Public Records
Mortgage History
| Date | Status | Borrower | Loan Amount |
|---|---|---|---|
| Open | Kirkpatrick James Allen | $198,000 | |
| Previous Owner | Kirkpatrick Myria | $201,572 |
Source: Public Records
Tax History Compared to Growth
Tax History
| Year | Tax Paid | Tax Assessment Tax Assessment Total Assessment is a certain percentage of the fair market value that is determined by local assessors to be the total taxable value of land and additions on the property. | Land | Improvement |
|---|---|---|---|---|
| 2024 | $6,277 | $379,400 | $156,100 | $223,300 |
| 2023 | $5,800 | $357,100 | $156,100 | $201,000 |
| 2022 | $4,371 | $356,400 | $155,400 | $201,000 |
| 2021 | $3,966 | $332,900 | $135,200 | $197,700 |
| 2020 | $4,090 | $307,500 | $128,800 | $178,700 |
| 2019 | $3,754 | $286,700 | $122,700 | $164,000 |
| 2018 | $3,528 | $273,100 | $116,900 | $156,200 |
| 2017 | $3,240 | $238,800 | $92,500 | $146,300 |
| 2016 | $3,132 | $224,400 | $83,500 | $140,900 |
| 2015 | $2,979 | $209,200 | $78,100 | $131,100 |
| 2014 | -- | $208,300 | $74,100 | $134,200 |
Source: Public Records
Map
Nearby Homes
- 2563 Alabama Ave S
- 2526 Alabama Ave S
- 2633 Zarthan Ave S
- 2644 Zarthan Ave S Unit 20
- 2648 Yosemite Ave S
- 2656 Xenwood Ave S
- 2210 Ridge Dr Unit 34
- 2250 Ridge Dr Unit 11
- 2724 Yosemite Ave S
- 2140 Ridge Dr Unit 24
- 2736 Brunswick Ave S
- 2813 Brunswick Ave S
- 2833 Alabama Ave S
- 2030 Ridge Dr Unit 33
- 2060 Ridge Dr Unit 16
- 2707 Edgewood Ave S
- 2744 Dakota Ave S
- 2841 Brunswick Ave S
- 2921 Blackstone Ave
- 2601 Salem Ave
- 5913 W 25th 1 2 St
- 5901 W 25 1/2 St
- 5901 W 25 1/2 St
- 5925 W 25 1/2 St
- 5901 W 25th 1 2 St
- 5913 5913 W 25 1 2 St
- 5902 W 26th St
- 5901 5901 W 25 1 2-Street-
- 5904 W 26th St
- 5837 W 25 1/2 St
- 5906 W 26th St
- 5808 W 26th St
- 5908 W 26th St
- 5810 W 26th St
- 5912 W 25 1/2 St
- 5812 W 26th St
- 5924 W 25 1/2 St
- 5900 W 25 1/2 St
- 5814 W 26th St
- 2555 Alabama Ave S