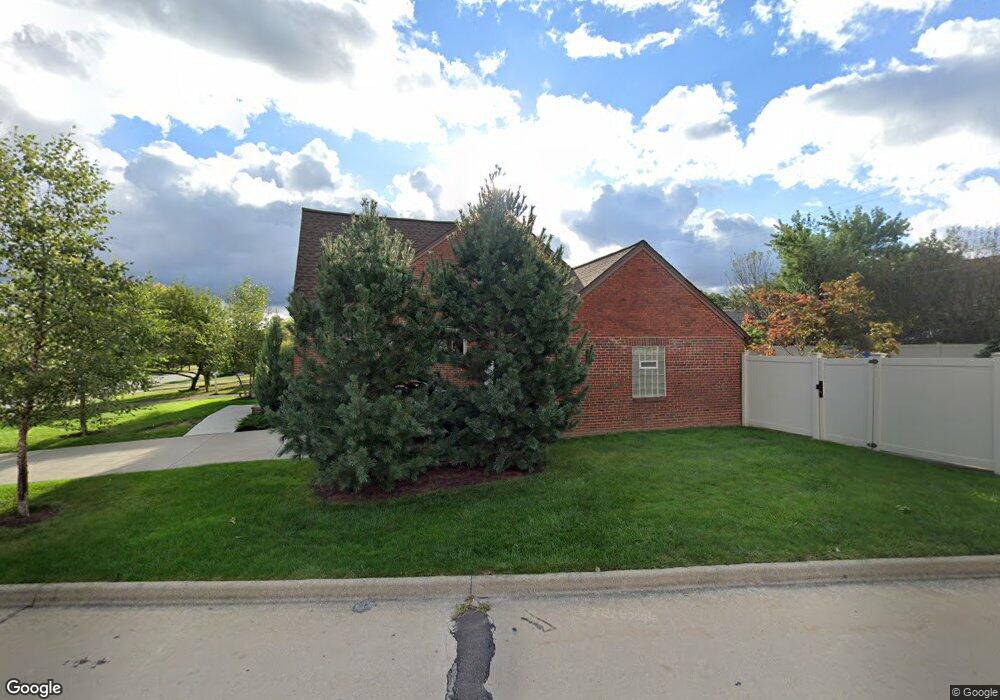
5915 Southington Dr Cleveland, OH 44129
Estimated Value: $205,079 - $236,000
4
Beds
1
Bath
1,404
Sq Ft
$160/Sq Ft
Est. Value
About This Home
This home is located at 5915 Southington Dr, Cleveland, OH 44129 and is currently estimated at $224,020, approximately $159 per square foot. 5915 Southington Dr is a home located in Cuyahoga County with nearby schools including Renwood Elementary School, Hillside Middle School, and Parma High School.
Ownership History
Date
Name
Owned For
Owner Type
Purchase Details
Closed on
Feb 28, 1995
Sold by
Hopkins Airport Limousin
Bought by
Wathey Barbara J Yurko
Current Estimated Value
Home Financials for this Owner
Home Financials are based on the most recent Mortgage that was taken out on this home.
Original Mortgage
$99,744
Interest Rate
9.21%
Mortgage Type
FHA
Purchase Details
Closed on
Aug 4, 1987
Sold by
Merski John Edward
Bought by
Kuchta Jeffrey R and Kuchta Maura C
Purchase Details
Closed on
Jan 10, 1986
Bought by
Merski John Edward
Purchase Details
Closed on
Dec 10, 1985
Sold by
James Thomas H
Bought by
Uslife Title Insurance Co
Purchase Details
Closed on
Apr 23, 1984
Sold by
Mchugh Michael
Bought by
James Thomas H
Purchase Details
Closed on
Aug 25, 1978
Sold by
Merjavy Margaret B
Bought by
Mchugh Michael
Purchase Details
Closed on
Jan 1, 1975
Bought by
Merjavy Margaret B
Create a Home Valuation Report for This Property
The Home Valuation Report is an in-depth analysis detailing your home's value as well as a comparison with similar homes in the area
Home Values in the Area
Average Home Value in this Area
Purchase History
| Date | Buyer | Sale Price | Title Company |
|---|---|---|---|
| Wathey Barbara J Yurko | $101,500 | -- | |
| Kuchta Jeffrey R | $69,500 | -- | |
| Merski John Edward | $66,000 | -- | |
| Uslife Title Insurance Co | -- | -- | |
| James Thomas H | $66,000 | -- | |
| Mchugh Michael | $57,000 | -- | |
| Merjavy Margaret B | -- | -- |
Source: Public Records
Mortgage History
| Date | Status | Borrower | Loan Amount |
|---|---|---|---|
| Closed | Wathey Barbara J Yurko | $99,744 |
Source: Public Records
Tax History Compared to Growth
Tax History
| Year | Tax Paid | Tax Assessment Tax Assessment Total Assessment is a certain percentage of the fair market value that is determined by local assessors to be the total taxable value of land and additions on the property. | Land | Improvement |
|---|---|---|---|---|
| 2024 | $3,075 | $59,850 | $12,810 | $47,040 |
| 2023 | $2,691 | $46,620 | $11,340 | $35,280 |
| 2022 | $2,690 | $46,620 | $11,340 | $35,280 |
| 2021 | $2,766 | $46,620 | $11,340 | $35,280 |
| 2020 | $2,275 | $35,840 | $8,720 | $27,130 |
| 2019 | $2,160 | $102,400 | $24,900 | $77,500 |
| 2018 | $2,173 | $35,840 | $8,720 | $27,130 |
| 2017 | $1,961 | $31,370 | $6,410 | $24,960 |
| 2016 | $1,949 | $31,370 | $6,410 | $24,960 |
| 2015 | $1,855 | $31,370 | $6,410 | $24,960 |
| 2014 | $1,855 | $32,000 | $6,550 | $25,450 |
Source: Public Records
Map
Nearby Homes
- 5700 Hollywood Dr
- 6510 Belmere Dr
- 6921 Hollywood Dr
- 5415 Pelham Dr
- 6189 W 54th St
- 6701 Pelham Dr
- 5205 Woodrow Ave
- 6298 Chestnut Hills Dr
- 6234 N Canterbury Rd
- 6227 Ridge Rd
- 6431 W Ridgewood Dr
- 6474 Ridge Rd
- 6468 State Rd Unit L11
- 5211 W Ridgewood Dr
- 6610 Renwood Dr
- 6111 Manchester Rd
- 4802 Grantwood Dr
- 6474 State Rd Unit I-10
- 6096 Wareham Dr
- 6485 Buckingham Dr
- 5909 Southington Dr
- 5903 Southington Dr
- 6009 Southington Dr
- 5910 Hollywood Dr
- 5916 Hollywood Dr
- 5815 Southington Dr
- 6017 Southington Dr
- 5902 Hollywood Dr
- 5908 Southington Dr
- 6016 Hollywood Dr
- 5809 Southington Dr
- 6006 Southington Dr
- 5814 Hollywood Dr
- 6023 Southington Dr
- 5902 Southington Dr
- 6010 Southington Dr
- 6016 Southington Dr
- 5812 Southington Dr
- 5803 Southington Dr
- 6022 Hollywood Dr