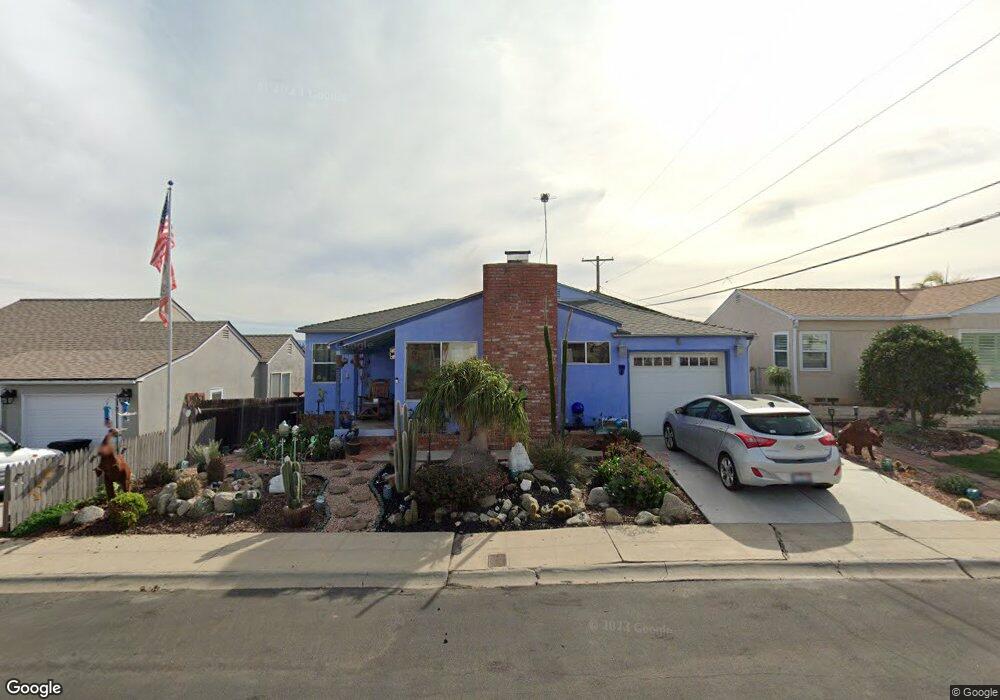
5917 Alta Mesa Way San Diego, CA 92115
El Cerrito NeighborhoodEstimated Value: $764,490 - $849,000
3
Beds
2
Baths
1,230
Sq Ft
$667/Sq Ft
Est. Value
About This Home
This home is located at 5917 Alta Mesa Way, San Diego, CA 92115 and is currently estimated at $819,873, approximately $666 per square foot. 5917 Alta Mesa Way is a home located in San Diego County with nearby schools including Clay Elementary School, Mann Middle School, and Crawford High School.
Ownership History
Date
Name
Owned For
Owner Type
Purchase Details
Closed on
Mar 25, 2008
Sold by
Gramley Sandra S and Kitchen Londa D
Bought by
Gramley Sandra S and Kitchen Londa D
Current Estimated Value
Home Financials for this Owner
Home Financials are based on the most recent Mortgage that was taken out on this home.
Original Mortgage
$303,000
Outstanding Balance
$140,500
Interest Rate
6.04%
Mortgage Type
New Conventional
Estimated Equity
$679,373
Purchase Details
Closed on
Feb 14, 2002
Sold by
Gramley Sandra S and Kitchen Londa D
Bought by
Gramley Sandra S and Kitchen Londa D
Home Financials for this Owner
Home Financials are based on the most recent Mortgage that was taken out on this home.
Original Mortgage
$191,000
Interest Rate
7.04%
Purchase Details
Closed on
May 28, 1998
Sold by
Gramley Sandra S and Kitchen Londa
Bought by
Gramley Sandra S and Kitchen Londa D
Purchase Details
Closed on
Nov 30, 1995
Sold by
Kitchen Londa and Gramley Sandra S
Bought by
Gramley Sandra S and Kitchen Londa D
Purchase Details
Closed on
Apr 16, 1993
Create a Home Valuation Report for This Property
The Home Valuation Report is an in-depth analysis detailing your home's value as well as a comparison with similar homes in the area
Home Values in the Area
Average Home Value in this Area
Purchase History
| Date | Buyer | Sale Price | Title Company |
|---|---|---|---|
| Gramley Sandra S | -- | Accommodation | |
| Gramley Sandra S | -- | First American Title Company | |
| Gramley Sandra S | -- | Fidelity National Title | |
| Gramley Sandra S | -- | Fidelity National Title | |
| Gramley Sandra S | -- | Benefit Land Title Company | |
| Gramley Sandra S | -- | Benefit Land Title Company | |
| Gramley Sandra S | -- | -- | |
| -- | $132,500 | -- |
Source: Public Records
Mortgage History
| Date | Status | Borrower | Loan Amount |
|---|---|---|---|
| Open | Gramley Sandra S | $303,000 | |
| Closed | Gramley Sandra S | $191,000 |
Source: Public Records
Tax History Compared to Growth
Tax History
| Year | Tax Paid | Tax Assessment Tax Assessment Total Assessment is a certain percentage of the fair market value that is determined by local assessors to be the total taxable value of land and additions on the property. | Land | Improvement |
|---|---|---|---|---|
| 2025 | $2,715 | $229,677 | $156,015 | $73,662 |
| 2024 | $2,715 | $225,174 | $152,956 | $72,218 |
| 2023 | $2,652 | $220,759 | $149,957 | $70,802 |
| 2022 | $2,580 | $216,431 | $147,017 | $69,414 |
| 2021 | $2,561 | $212,188 | $144,135 | $68,053 |
| 2020 | $2,530 | $210,014 | $142,658 | $67,356 |
| 2019 | $2,483 | $205,897 | $139,861 | $66,036 |
| 2018 | $2,321 | $201,861 | $137,119 | $64,742 |
| 2017 | $2,265 | $197,904 | $134,431 | $63,473 |
| 2016 | $2,226 | $194,025 | $131,796 | $62,229 |
| 2015 | $2,192 | $191,112 | $129,817 | $61,295 |
| 2014 | $2,157 | $187,370 | $127,275 | $60,095 |
Source: Public Records
Map
Nearby Homes
- 4352 Athens St
- 4152 60th St
- 4334 College Ave
- 4348 College Ave Unit 1
- 4281 College Ave
- 5895 Estelle St
- 6143 Tarragona Dr
- 5885 El Cajon Blvd Unit 301
- 5885 El Cajon Blvd Unit 214
- 5885 El Cajon Blvd Unit 204
- 4515 College Way Unit P
- 4540 60th St Unit 303
- 4540 60th St Unit 211
- 5643 Meade Ave
- 4560 60th St Unit 11
- 4397 Cartagena Dr
- 6283 Lorca Dr
- 3930 60th St Unit 171
- 3934 60th St Unit 158
- 5550 Adelaide Ave Unit 11
- 5911 Alta Mesa Way
- 5921 Alta Mesa Way
- 5927 Alta Mesa Way
- 5905 Alta Mesa Way
- 4304 Athens St
- 4241 E Overlook Dr
- 4305 E Overlook Dr
- 5935 Alta Mesa Way
- 5941 Alta Mesa Way
- 4312 Athens St
- 4311 E Overlook Dr
- 5947 Alta Mesa Way
- 4307 Athens St
- 4227 E Overlook Dr
- 4318 Athens St
- 4248 E Overlook Dr
- 4317 E Overlook Dr
- 4260 E Overlook Dr
- 4242 E Overlook Dr
- 5955 Alta Mesa Way