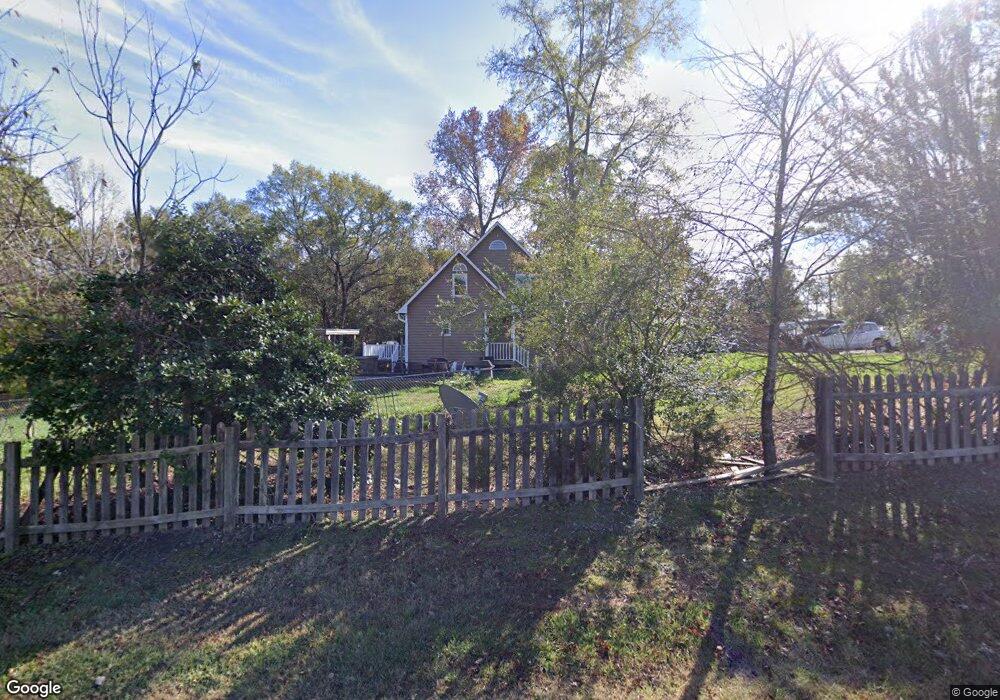
5917 Rock Service Station Rd Raleigh, NC 27603
Estimated Value: $453,000 - $526,258
--
Bed
2
Baths
1,948
Sq Ft
$250/Sq Ft
Est. Value
About This Home
This home is located at 5917 Rock Service Station Rd, Raleigh, NC 27603 and is currently estimated at $487,815, approximately $250 per square foot. 5917 Rock Service Station Rd is a home located in Wake County with nearby schools including Rand Road Elementary, North Garner Middle, and Garner High.
Ownership History
Date
Name
Owned For
Owner Type
Purchase Details
Closed on
Jun 24, 2022
Sold by
Wade Bryan Iii William and Wade Nicole Chelsea
Bought by
Bryan William Wade
Current Estimated Value
Home Financials for this Owner
Home Financials are based on the most recent Mortgage that was taken out on this home.
Original Mortgage
$268,000
Outstanding Balance
$254,394
Interest Rate
5%
Mortgage Type
New Conventional
Estimated Equity
$233,421
Purchase Details
Closed on
Sep 22, 2017
Sold by
Cottle Anthony M and Cottle Susan W
Bought by
Bryan William Wade and Capps Chelsea Nicole
Home Financials for this Owner
Home Financials are based on the most recent Mortgage that was taken out on this home.
Original Mortgage
$232,323
Interest Rate
3.9%
Mortgage Type
New Conventional
Purchase Details
Closed on
Jul 9, 1992
Bought by
Cottle Anthony M and Cottle Susan W
Create a Home Valuation Report for This Property
The Home Valuation Report is an in-depth analysis detailing your home's value as well as a comparison with similar homes in the area
Home Values in the Area
Average Home Value in this Area
Purchase History
| Date | Buyer | Sale Price | Title Company |
|---|---|---|---|
| Bryan William Wade | -- | Lynda R Herring Pa | |
| Bryan William Wade | $230,000 | None Available | |
| Cottle Anthony M | $99,000 | -- |
Source: Public Records
Mortgage History
| Date | Status | Borrower | Loan Amount |
|---|---|---|---|
| Open | Bryan William Wade | $268,000 | |
| Previous Owner | Bryan William Wade | $232,323 |
Source: Public Records
Tax History Compared to Growth
Tax History
| Year | Tax Paid | Tax Assessment Tax Assessment Total Assessment is a certain percentage of the fair market value that is determined by local assessors to be the total taxable value of land and additions on the property. | Land | Improvement |
|---|---|---|---|---|
| 2025 | $2,973 | $461,721 | $223,600 | $238,121 |
| 2024 | $2,887 | $461,721 | $223,600 | $238,121 |
| 2023 | $2,526 | $321,430 | $134,520 | $186,910 |
| 2022 | $2,341 | $321,430 | $134,520 | $186,910 |
| 2021 | $2,279 | $321,430 | $134,520 | $186,910 |
| 2020 | $2,241 | $321,430 | $134,520 | $186,910 |
| 2019 | $2,116 | $256,667 | $125,340 | $131,327 |
| 2018 | $1,946 | $256,667 | $125,340 | $131,327 |
| 2017 | $1,845 | $256,667 | $125,340 | $131,327 |
| 2016 | $1,808 | $256,667 | $125,340 | $131,327 |
| 2015 | $1,880 | $267,852 | $132,700 | $135,152 |
| 2014 | $1,782 | $267,852 | $132,700 | $135,152 |
Source: Public Records
Map
Nearby Homes
- 1017 Azalea Garden Cir
- 1025 Azalea Garden Cir
- 1033 Azalea Garden Cir
- 1037 Azalea Garden Cir
- 1041 Azalea Garden Cir
- 1045 Azalea Garden Cir
- 1053 Azalea Garden Cir
- 1057 Azalea Garden Cir
- 1061 Azalea Garden Cir
- 6521 Camellia Creek Dr
- 936 Elbridge Dr
- 1220 Turner Woods Dr
- 1017 Widgeon Way
- 1005 Turner Meadow Dr
- 6501 Rock Service Station Rd
- 1200 Misty Morning Way
- 1021 Wintu Ct
- 5512 Glenhurst Dr N
- 6600 Rock Service Station Rd
- 1009 Feldmen Dr
- 6009 Rock Service Station Rd
- 1220 Urban Legend Dr
- 5901 Rock Service Station Rd
- 6108 Mornington Dr
- 6109 Mornington Dr
- 1221 Urban Legend Dr
- 6029 Rock Service Station Rd
- 6105 Mornington Dr
- 5845 Rock Service Station Rd
- 6104 Mornington Dr
- 5904 Rock Service Station Rd
- 5829 Lunenburg Dr
- 6030 Rock Service Station Rd
- 6030 Rock Service Station Rd Unit none
- 5833 Lunenburg Dr
- 6100 Lunenburg Dr
- 1001 Azalea Garden Cir
- 6100 Mornington Dr
- 5825 Lunenburg Dr
- 5837 Rock Service Station Rd