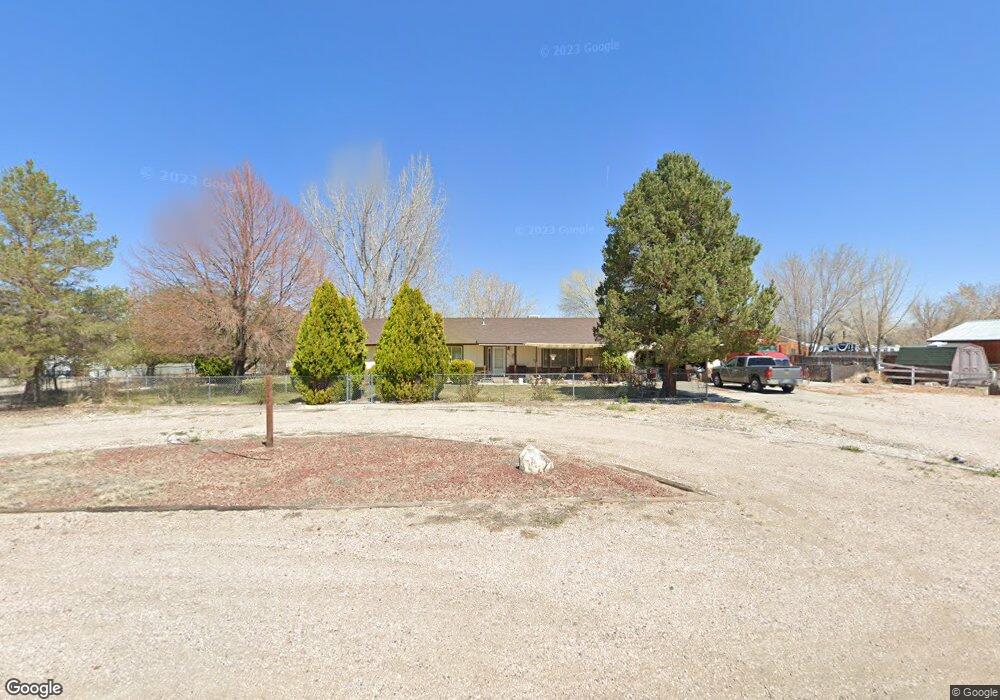
5918 Hooper Place Fallon, NV 89406
Estimated Value: $486,000 - $551,000
4
Beds
2
Baths
1,900
Sq Ft
$273/Sq Ft
Est. Value
About This Home
This home is located at 5918 Hooper Place, Fallon, NV 89406 and is currently estimated at $518,088, approximately $272 per square foot. 5918 Hooper Place is a home located in Churchill County with nearby schools including Lahontan Elementary School, E.C. Best Elementary School, and Numa Elementary School.
Ownership History
Date
Name
Owned For
Owner Type
Purchase Details
Closed on
Sep 17, 2024
Sold by
Meyer Teresa Ann
Bought by
Newman Loyd Douglas
Current Estimated Value
Purchase Details
Closed on
Jul 12, 2022
Sold by
Sevana Newman Bennie
Bought by
Newman Loyd Douglas and Meyer Teresa Ann
Purchase Details
Closed on
Mar 31, 2016
Sold by
Newman Bennie S
Bought by
Newman Bennie Sevana
Purchase Details
Closed on
Mar 28, 2011
Sold by
Hoepfer Catherine and Caulfield Janice
Bought by
Newman Bennie S
Home Financials for this Owner
Home Financials are based on the most recent Mortgage that was taken out on this home.
Original Mortgage
$165,690
Interest Rate
4.75%
Mortgage Type
FHA
Purchase Details
Closed on
Feb 18, 2011
Sold by
Hoepfer Catherine
Bought by
Hoepfer Catherine and Caulfield Janice
Home Financials for this Owner
Home Financials are based on the most recent Mortgage that was taken out on this home.
Original Mortgage
$165,690
Interest Rate
4.75%
Mortgage Type
FHA
Purchase Details
Closed on
Oct 3, 2007
Sold by
Hoepfer Dennis D
Bought by
Hoepfer Dennis D and The Dennis D Hoepfer Trust
Create a Home Valuation Report for This Property
The Home Valuation Report is an in-depth analysis detailing your home's value as well as a comparison with similar homes in the area
Purchase History
| Date | Buyer | Sale Price | Title Company |
|---|---|---|---|
| Newman Loyd Douglas | -- | None Listed On Document | |
| Newman Loyd Douglas | -- | None Listed On Document | |
| Newman Bennie Sevana | -- | None Available | |
| Newman Bennie S | $170,000 | Western Nevada Title Company | |
| Hoepfer Catherine | -- | None Available | |
| Hoepfer Dennis D | $200,000 | None Available |
Source: Public Records
Mortgage History
| Date | Status | Borrower | Loan Amount |
|---|---|---|---|
| Previous Owner | Newman Bennie S | $165,690 |
Source: Public Records
Tax History
| Year | Tax Paid | Tax Assessment Tax Assessment Total Assessment is a certain percentage of the fair market value that is determined by local assessors to be the total taxable value of land and additions on the property. | Land | Improvement |
|---|---|---|---|---|
| 2025 | $2,270 | $97,371 | $22,750 | $74,621 |
| 2024 | $2,270 | $98,235 | $22,750 | $75,485 |
| 2023 | $2,270 | $91,204 | $22,750 | $68,454 |
| 2022 | $2,036 | $70,823 | $11,375 | $59,448 |
| 2021 | $1,999 | $69,541 | $11,375 | $58,166 |
| 2020 | $1,990 | $70,850 | $11,375 | $59,475 |
| 2019 | $1,921 | $69,328 | $11,375 | $57,953 |
| 2018 | $1,865 | $68,125 | $11,375 | $56,750 |
| 2017 | $1,791 | $68,389 | $11,375 | $57,014 |
| 2016 | $1,751 | $64,187 | $11,375 | $52,812 |
| 2015 | $1,712 | $61,041 | $11,375 | $49,666 |
| 2014 | $1,668 | $56,712 | $11,375 | $45,337 |
Source: Public Records
Map
Nearby Homes
- 5800 Reno Hwy
- 785 Wetland View
- 601 Windmill Dr
- 1001 Sheckler Cutoff
- 6270 Westwind Way
- 1001 Sheckler Cut Off
- 774 Copperwood Dr
- 5326 Desert Hills Loop
- 1556 Sky Ridge Dr
- 200 Mclean Rd
- 6811 Reno Hwy
- 1820 Heidi Rd
- 1850 Heidi Rd
- 5655 Dillon Dr
- 4755 Alcorn Rd
- 7135 Reno Hwy
- 6312 Sierra Way
- 4468 Hawk Dr
- 6255 Sierra Way
- 7278 Reno Hwy
- 5934 Hooper Place
- 5950 Hooper Place
- 5850 Hooper Place
- 5885 Hooper Place
- 5984 Hooper Place
- 5835 Hooper Place
- 5818 Hooper Place
- 5787 Reno Hwy
- 360 Sheckler Cut Off
- 5805 Hooper Place
- 350 Sheckler Cut Off
- 399 Sheckler Cut Off
- 5790 Hooper Place
- 40 Sheckler Cut Off
- 5840 Rivers Edge Dr
- 5890 Rivers Edge Dr
- 5860 Rivers Edge Dr
- 400 Sheckler Cut Off
- 17-20-28 Off of Victor Rd
- 491 Sheckler Cut Off
Your Personal Tour Guide
Ask me questions while you tour the home.