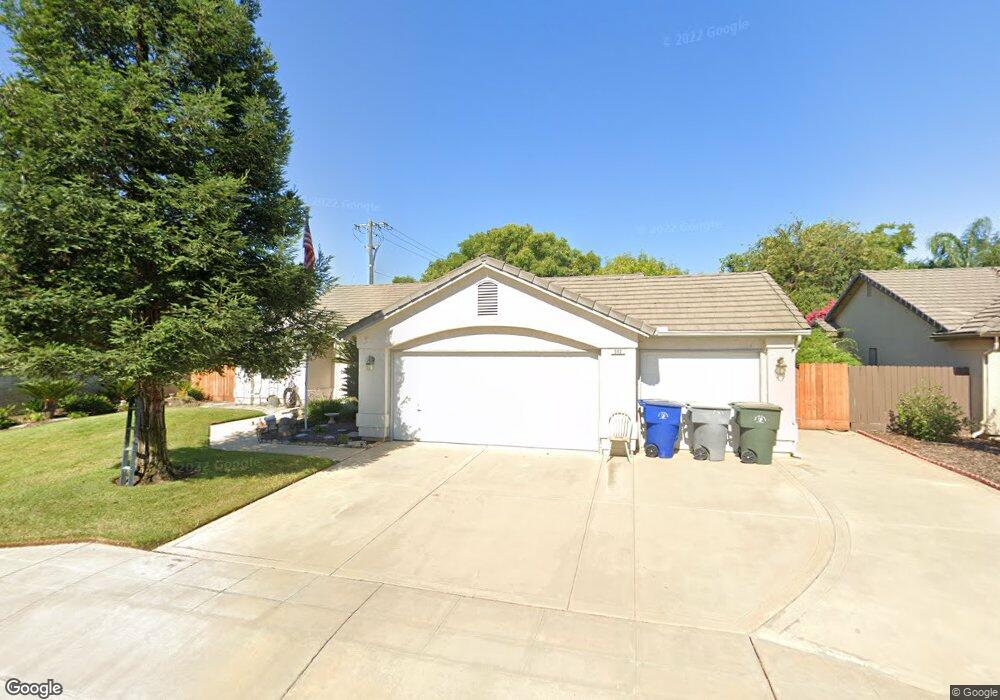
592 Arroyo Ave Clovis, CA 93611
Estimated Value: $389,000 - $493,000
3
Beds
2
Baths
1,618
Sq Ft
$279/Sq Ft
Est. Value
About This Home
This home is located at 592 Arroyo Ave, Clovis, CA 93611 and is currently estimated at $450,880, approximately $278 per square foot. 592 Arroyo Ave is a home located in Fresno County with nearby schools including Cox Elementary School, Clark Intermediate School, and Clovis High School.
Ownership History
Date
Name
Owned For
Owner Type
Purchase Details
Closed on
Oct 22, 2012
Sold by
Thompson Marlene
Bought by
Revoc Thompson Marlene Setsuko and Revoc Marlene Setsuko Thompson
Current Estimated Value
Purchase Details
Closed on
Jun 12, 1996
Sold by
Henley & Kramer Inc
Bought by
Thompson James and Thompson Marlene
Home Financials for this Owner
Home Financials are based on the most recent Mortgage that was taken out on this home.
Original Mortgage
$89,600
Interest Rate
7.58%
Purchase Details
Closed on
Jan 25, 1996
Sold by
Roush Richard A and Stonhaus William C
Bought by
Henley & Kramer Inc
Home Financials for this Owner
Home Financials are based on the most recent Mortgage that was taken out on this home.
Original Mortgage
$112,000
Interest Rate
7.14%
Purchase Details
Closed on
Jul 22, 1994
Sold by
Roush Richard A and Roush Terree L
Bought by
Roush Richard A and Stonhaus William C
Purchase Details
Closed on
Jul 7, 1994
Sold by
Tatham William R and Tatham Susan
Bought by
Roush Richard A
Create a Home Valuation Report for This Property
The Home Valuation Report is an in-depth analysis detailing your home's value as well as a comparison with similar homes in the area
Home Values in the Area
Average Home Value in this Area
Purchase History
| Date | Buyer | Sale Price | Title Company |
|---|---|---|---|
| Revoc Thompson Marlene Setsuko | -- | None Available | |
| Thompson James | $112,000 | North American Title Co | |
| Henley & Kramer Inc | $273,500 | North American Title Co | |
| Roush Richard A | -- | -- | |
| Roush Richard A | $357,000 | Central Title Company |
Source: Public Records
Mortgage History
| Date | Status | Borrower | Loan Amount |
|---|---|---|---|
| Previous Owner | Thompson James | $89,600 | |
| Previous Owner | Henley & Kramer Inc | $112,000 |
Source: Public Records
Tax History
| Year | Tax Paid | Tax Assessment Tax Assessment Total Assessment is a certain percentage of the fair market value that is determined by local assessors to be the total taxable value of land and additions on the property. | Land | Improvement |
|---|---|---|---|---|
| 2025 | $4,976 | $413,100 | $153,000 | $260,100 |
| 2023 | $2,100 | $175,301 | $70,429 | $104,872 |
| 2022 | $2,072 | $171,865 | $69,049 | $102,816 |
| 2021 | $2,016 | $168,496 | $67,696 | $100,800 |
| 2020 | $2,007 | $166,769 | $67,002 | $99,767 |
| 2019 | $1,969 | $163,500 | $65,689 | $97,811 |
| 2018 | $1,927 | $160,295 | $64,401 | $95,894 |
| 2017 | $1,881 | $157,153 | $63,139 | $94,014 |
| 2016 | $1,819 | $154,072 | $61,901 | $92,171 |
| 2015 | $1,792 | $151,759 | $60,972 | $90,787 |
| 2014 | $1,759 | $148,787 | $59,778 | $89,009 |
Source: Public Records
Map
Nearby Homes
- 335 McKelvy Ave
- 344 McKelvy Ave
- 2691 Morris Ave
- 865 McKelvy Ave
- 793 Applegate Ave
- 2337 Wrenwood Ave
- 637 Coventry Ave
- 2681 Wrenwood Ave
- 2231 Escalon Ave
- 937 Filbert Ave
- 2535 Sierra Ave
- 2871 Wrenwood Ave
- 2216 Ellery Ave
- 2325 Sierra Ave
- 2034 Wrenwood Ave
- 2549 Purvis Ave
- 2043 Escalon Ave
- 2963 Finchwood Ave
- 1946 Calimyrna Ave
- 603 Kaweah Ave
- 582 Arroyo Ave
- 2485 Bullard Ave
- 2534 Calimyrna Ave
- 572 Arroyo Ave
- 702 Pecan Ave
- 552 Arroyo Ave
- 2544 Calimyrna Ave
- 571 Arroyo Ave
- 701 Pistachio Ave
- 709 Pecan Ave
- 712 Pecan Ave
- 551 Arroyo Ave
- 2554 Calimyrna Ave
- 542 Arroyo Ave
- 711 Pistachio Ave
- 2553 Calimyrna Ave
- 719 Pecan Ave
- 541 Arroyo Ave
- 722 Pecan Ave
- 2564 Calimyrna Ave
Your Personal Tour Guide
Ask me questions while you tour the home.