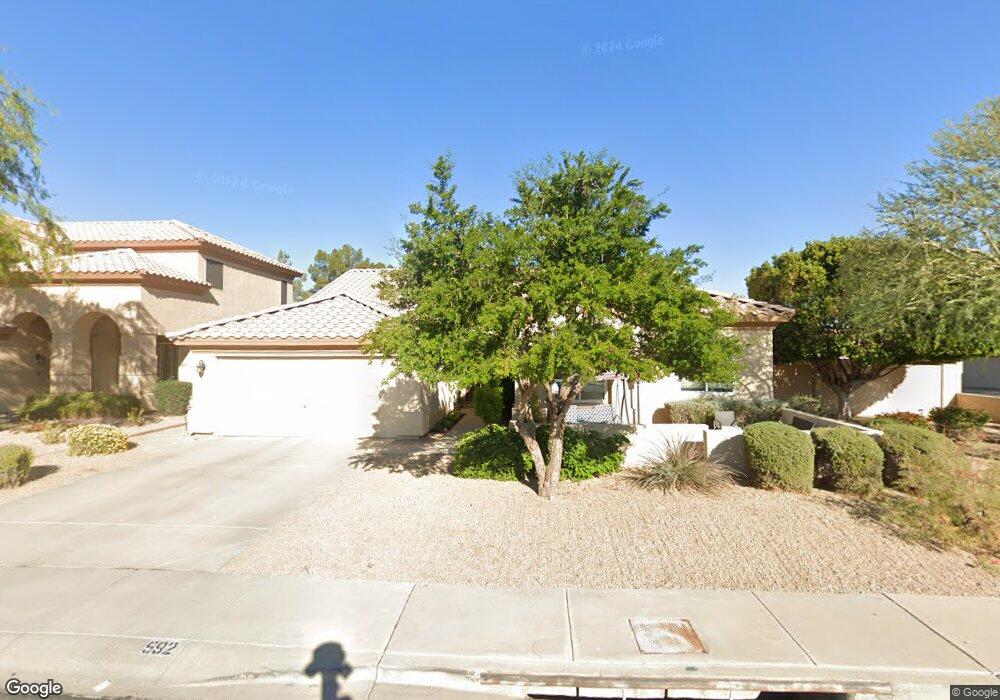
592 E Maria Ln Tempe, AZ 85284
West Chandler NeighborhoodEstimated Value: $628,264 - $711,000
Studio
3
Baths
2,280
Sq Ft
$300/Sq Ft
Est. Value
About This Home
This home is located at 592 E Maria Ln, Tempe, AZ 85284 and is currently estimated at $683,066, approximately $299 per square foot. 592 E Maria Ln is a home located in Maricopa County with nearby schools including Kyrene de la Mariposa Elementary School, Kyrene del Pueblo Middle School, and Corona Del Sol High School.
Ownership History
Date
Name
Owned For
Owner Type
Purchase Details
Closed on
Aug 21, 2018
Sold by
Dragon Christopher P and Dragon Penelope L
Bought by
Dragon Christopher P and Dragon Penelope L
Current Estimated Value
Purchase Details
Closed on
Mar 11, 2003
Sold by
Dragon Christopher P and Dragon Penelope L
Bought by
Dragon Christopher P and Dragon Penelope L
Home Financials for this Owner
Home Financials are based on the most recent Mortgage that was taken out on this home.
Original Mortgage
$176,000
Outstanding Balance
$75,386
Interest Rate
5.83%
Estimated Equity
$607,680
Purchase Details
Closed on
Jun 13, 2001
Sold by
Dragon Christopher P and Dragon Penelope L
Bought by
Dragon Christopher P and Dragon Penelope L
Purchase Details
Closed on
Jun 24, 1996
Sold by
North American Title Agency Of Az Inc
Bought by
Dragon Christopher P and Dragon Penelope
Home Financials for this Owner
Home Financials are based on the most recent Mortgage that was taken out on this home.
Original Mortgage
$184,900
Interest Rate
8.09%
Mortgage Type
New Conventional
Create a Home Valuation Report for This Property
The Home Valuation Report is an in-depth analysis detailing your home's value as well as a comparison with similar homes in the area
Home Values in the Area
Average Home Value in this Area
Purchase History
| Date | Buyer | Sale Price | Title Company |
|---|---|---|---|
| Dragon Christopher P | -- | None Available | |
| Dragon Christopher P | -- | Century Title Agency Inc | |
| Dragon Christopher P | -- | -- | |
| Dragon Christopher P | $182,258 | North American Title Agency |
Source: Public Records
Mortgage History
| Date | Status | Borrower | Loan Amount |
|---|---|---|---|
| Open | Dragon Christopher P | $176,000 | |
| Closed | Dragon Christopher P | $184,900 |
Source: Public Records
Tax History
| Year | Tax Paid | Tax Assessment Tax Assessment Total Assessment is a certain percentage of the fair market value that is determined by local assessors to be the total taxable value of land and additions on the property. | Land | Improvement |
|---|---|---|---|---|
| 2025 | $3,997 | $42,162 | -- | -- |
| 2024 | $3,748 | $40,154 | -- | -- |
| 2023 | $3,748 | $50,780 | $10,150 | $40,630 |
| 2022 | $3,546 | $39,230 | $7,840 | $31,390 |
| 2021 | $3,660 | $37,670 | $7,530 | $30,140 |
| 2020 | $3,572 | $36,330 | $7,260 | $29,070 |
| 2019 | $3,459 | $33,680 | $6,730 | $26,950 |
| 2018 | $3,343 | $32,180 | $6,430 | $25,750 |
| 2017 | $3,205 | $30,660 | $6,130 | $24,530 |
| 2016 | $3,250 | $31,160 | $6,230 | $24,930 |
| 2015 | $3,002 | $28,170 | $5,630 | $22,540 |
Source: Public Records
Map
Nearby Homes
- 4830 W Shannon Ct
- 4820 W Shannon Ct
- 9276 S Myrtle Ave
- 5040 W Ivanhoe St
- 1001 E Caroline Ln
- 12651 S 71st St
- 5142 W Harrison St
- 22 E Caroline Ln
- 9433 S Stanley Place
- 4653 W Dublin St
- 821 N Albert Dr
- 1020 E Caroline Ln
- 56 E Dawn Dr
- 5773 W Shannon St
- 1101 E Warner Rd Unit 117
- 5823 W Gary Dr
- 42 W La Vieve Ln
- 85 W La Vieve Ln
- 845 N Oak Ct
- 834 N Oak Ct
- 572 E Maria Ln
- 614 E Maria Ln
- 552 E Maria Ln
- 573 E Maria Ln
- 565 E Stacey Ln
- 634 E Maria Ln
- 613 E Maria Ln
- 532 E Maria Ln
- 553 E Maria Ln
- 593 E Stacey Ln
- 633 E Maria Ln
- 533 E Maria Ln
- 621 E Stacey Ln
- 654 E Maria Ln
- 512 E Maria Ln
- 574 E Yvonne Ln
- 513 E Maria Ln
- 554 E Yvonne Ln
- 653 E Maria Ln
- 649 E Stacey Ln
Your Personal Tour Guide
Ask me questions while you tour the home.