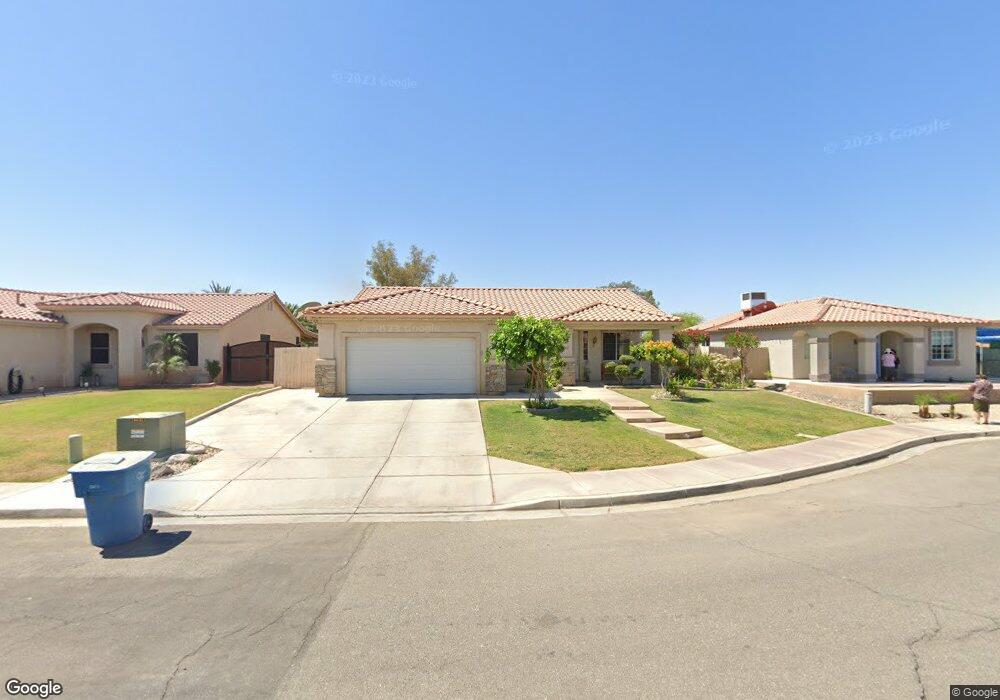
592 Tamarisk St Imperial, CA 92251
Estimated Value: $416,000 - $481,000
4
Beds
2
Baths
1,608
Sq Ft
$275/Sq Ft
Est. Value
About This Home
This home is located at 592 Tamarisk St, Imperial, CA 92251 and is currently estimated at $442,444, approximately $275 per square foot. 592 Tamarisk St is a home located in Imperial County with nearby schools including T.L. Waggoner Elementary School, Frank M. Wright Middle School, and Imperial High School.
Ownership History
Date
Name
Owned For
Owner Type
Purchase Details
Closed on
Jun 20, 2024
Sold by
Reynoso Jose Socorro
Bought by
Jose S Reynoso Living Trust and Reynoso
Current Estimated Value
Purchase Details
Closed on
Nov 12, 2009
Sold by
Delgado Jose A
Bought by
Reynoso Jose Socorro
Home Financials for this Owner
Home Financials are based on the most recent Mortgage that was taken out on this home.
Original Mortgage
$162,011
Interest Rate
4.88%
Mortgage Type
FHA
Purchase Details
Closed on
Mar 19, 2002
Sold by
Reflections Residential Investors Llc
Bought by
Delgado Jose A
Home Financials for this Owner
Home Financials are based on the most recent Mortgage that was taken out on this home.
Original Mortgage
$156,600
Interest Rate
6.29%
Mortgage Type
Purchase Money Mortgage
Create a Home Valuation Report for This Property
The Home Valuation Report is an in-depth analysis detailing your home's value as well as a comparison with similar homes in the area
Purchase History
| Date | Buyer | Sale Price | Title Company |
|---|---|---|---|
| Jose S Reynoso Living Trust | -- | None Listed On Document | |
| Reynoso Jose Socorro | $165,000 | Orange Coast Title Company | |
| Delgado Jose A | $161,500 | First American |
Source: Public Records
Mortgage History
| Date | Status | Borrower | Loan Amount |
|---|---|---|---|
| Previous Owner | Reynoso Jose Socorro | $162,011 | |
| Previous Owner | Delgado Jose A | $156,600 | |
| Closed | Delgado Jose A | $4,843 |
Source: Public Records
Tax History
| Year | Tax Paid | Tax Assessment Tax Assessment Total Assessment is a certain percentage of the fair market value that is determined by local assessors to be the total taxable value of land and additions on the property. | Land | Improvement |
|---|---|---|---|---|
| 2025 | $2,246 | $212,971 | $51,627 | $161,344 |
| 2023 | $2,246 | $204,703 | $49,623 | $155,080 |
| 2022 | $2,196 | $200,690 | $48,650 | $152,040 |
| 2021 | $2,161 | $196,756 | $47,697 | $149,059 |
| 2020 | $2,138 | $194,739 | $47,208 | $147,531 |
| 2019 | $2,107 | $190,922 | $46,283 | $144,639 |
| 2018 | $2,078 | $187,179 | $45,376 | $141,803 |
| 2017 | $1,956 | $183,510 | $44,487 | $139,023 |
| 2016 | $1,883 | $179,913 | $43,615 | $136,298 |
| 2015 | $1,903 | $177,211 | $42,960 | $134,251 |
| 2014 | $1,619 | $159,000 | $35,000 | $124,000 |
Source: Public Records
Map
Nearby Homes
- 586 Larkspur Ln
- 545 Mesquite St
- 2424 La Guardia Ct
- 678 Mesquite St
- 498 W Wall Rd
- 2465 O Hare Ct
- 684 Boley Field Dr W
- 681 Ocaso St
- 675 Ocaso St
- 674 Ocaso St
- 1850 Lincoln Ave Unit 163
- 1850 Lincoln Ave Unit 120
- 1850 Lincoln Ave Unit 184
- 1850 W Lincoln Ave Unit 26
- 1850 W Lincoln Ave Unit 57
- 823 W Aten Rd
- 612 Las Villas St
- 623 Bahia St
- 385 W Aten Rd
- 2208 N La Brucherie Rd Unit 2204
- 590 Tamarisk St
- 594 Tamarisk St
- 2327 Bougainvillea Trail
- 2329 Bougainvillea Trail
- 2341 Bougainvillea Trail
- 2339 Bougainvillea Trail
- 2337 Bougainvillea Trail
- 591 Tamarisk St
- 593 Tamarisk St
- 595 Tamarisk St
- 589 Tamarisk St
- 2325 Bougainvillea Trail
- 2335 Bougainvillea Trail
- 587 Tamarisk St
- 2323 Bougainvillea Trail
- 2340 Bougainvillea Trail
- 2338 Bougainvillea Trail
- 2342 Bougainvillea Trail
- 2324 Bougainvillea Trail
- 2344 Bougainvillea Trail
Your Personal Tour Guide
Ask me questions while you tour the home.