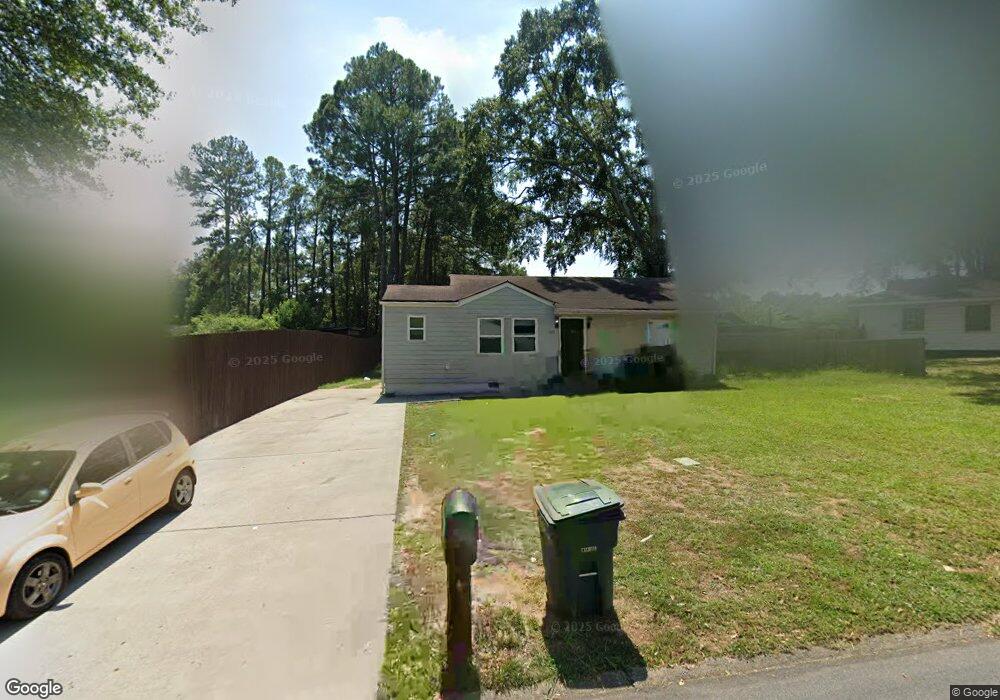
592 Tom Read Dr Marietta, GA 30062
Eastern Marietta NeighborhoodEstimated Value: $210,000 - $255,000
1
Bed
1
Bath
864
Sq Ft
$273/Sq Ft
Est. Value
About This Home
This home is located at 592 Tom Read Dr, Marietta, GA 30062 and is currently estimated at $236,241, approximately $273 per square foot. 592 Tom Read Dr is a home located in Cobb County with nearby schools including Marietta Sixth Grade Academy, Sawyer Road Elementary School, and Marietta Middle School.
Ownership History
Date
Name
Owned For
Owner Type
Purchase Details
Closed on
Apr 21, 2021
Sold by
Kurashi Amman
Bought by
Kurashi Amman and Kurashi Fezan
Current Estimated Value
Purchase Details
Closed on
Dec 14, 2018
Sold by
Tucker Scott W
Bought by
Kurashi Danial and Kurashi Amman
Purchase Details
Closed on
Jan 11, 2008
Sold by
Tucker Scott W
Bought by
Roper James
Home Financials for this Owner
Home Financials are based on the most recent Mortgage that was taken out on this home.
Original Mortgage
$85,000
Interest Rate
5.94%
Mortgage Type
Trade
Create a Home Valuation Report for This Property
The Home Valuation Report is an in-depth analysis detailing your home's value as well as a comparison with similar homes in the area
Home Values in the Area
Average Home Value in this Area
Purchase History
| Date | Buyer | Sale Price | Title Company |
|---|---|---|---|
| Kurashi Amman | -- | None Available | |
| Kurashi Danial | $122,000 | -- | |
| Roper James | $90,000 | -- |
Source: Public Records
Mortgage History
| Date | Status | Borrower | Loan Amount |
|---|---|---|---|
| Previous Owner | Roper James | $85,000 |
Source: Public Records
Tax History Compared to Growth
Tax History
| Year | Tax Paid | Tax Assessment Tax Assessment Total Assessment is a certain percentage of the fair market value that is determined by local assessors to be the total taxable value of land and additions on the property. | Land | Improvement |
|---|---|---|---|---|
| 2025 | $719 | $85,044 | $36,000 | $49,044 |
| 2024 | $657 | $77,604 | $28,000 | $49,604 |
| 2023 | $657 | $77,604 | $28,000 | $49,604 |
| 2022 | $587 | $69,328 | $28,000 | $41,328 |
| 2021 | $472 | $54,912 | $24,000 | $30,912 |
| 2020 | $415 | $48,368 | $16,000 | $32,368 |
| 2019 | $307 | $35,780 | $12,000 | $23,780 |
| 2018 | $228 | $26,596 | $12,000 | $14,596 |
| 2017 | $179 | $25,920 | $12,000 | $13,920 |
| 2016 | $179 | $25,920 | $12,000 | $13,920 |
| 2015 | $164 | $21,880 | $10,000 | $11,880 |
| 2014 | $170 | $21,880 | $0 | $0 |
Source: Public Records
Map
Nearby Homes