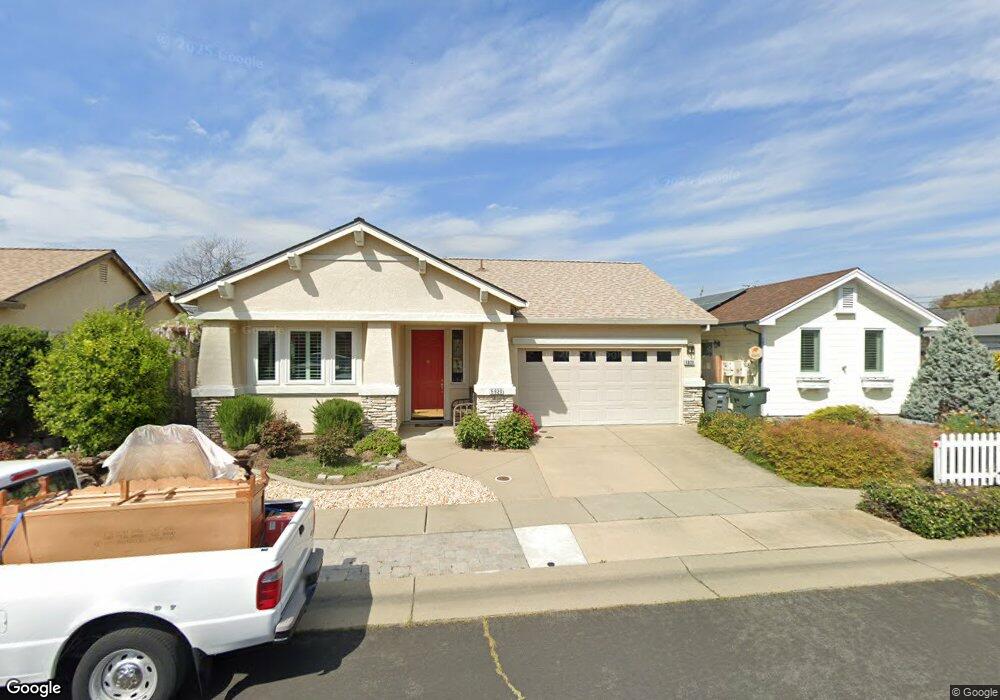
5920 Becky Way Loomis, CA 95650
Estimated Value: $535,000 - $629,000
3
Beds
2
Baths
1,372
Sq Ft
$418/Sq Ft
Est. Value
About This Home
This home is located at 5920 Becky Way, Loomis, CA 95650 and is currently estimated at $573,691, approximately $418 per square foot. 5920 Becky Way is a home located in Placer County with nearby schools including Del Oro High School, Loomis Basin Charter School, and Sierra Foothills Academy.
Ownership History
Date
Name
Owned For
Owner Type
Purchase Details
Closed on
Mar 27, 2015
Sold by
Rhodes Robert C and Rhodes Janet S
Bought by
Robert C Rhodes & Janet S Rhodes Trust
Current Estimated Value
Home Financials for this Owner
Home Financials are based on the most recent Mortgage that was taken out on this home.
Original Mortgage
$271,000
Outstanding Balance
$208,393
Interest Rate
3.71%
Mortgage Type
New Conventional
Estimated Equity
$365,298
Purchase Details
Closed on
Jan 11, 2006
Sold by
Rhodes Robert C and Rhodes Janet S
Bought by
Rhodes Robert C and Rhodes Janet S
Purchase Details
Closed on
Jun 12, 2002
Sold by
Stonebridge Loomis Llc
Bought by
Rhodes Robert C and Rhodes Janet S
Home Financials for this Owner
Home Financials are based on the most recent Mortgage that was taken out on this home.
Original Mortgage
$199,990
Interest Rate
6.74%
Create a Home Valuation Report for This Property
The Home Valuation Report is an in-depth analysis detailing your home's value as well as a comparison with similar homes in the area
Home Values in the Area
Average Home Value in this Area
Purchase History
| Date | Buyer | Sale Price | Title Company |
|---|---|---|---|
| Robert C Rhodes & Janet S Rhodes Trust | -- | Fidelity National Title Co | |
| Rhodes Robert C | -- | Fidelity National Title Co | |
| Rhodes Robert C | -- | None Available | |
| Rhodes Robert C | $250,000 | First American Title Ins Co |
Source: Public Records
Mortgage History
| Date | Status | Borrower | Loan Amount |
|---|---|---|---|
| Open | Rhodes Robert C | $271,000 | |
| Closed | Rhodes Robert C | $199,990 |
Source: Public Records
Tax History Compared to Growth
Tax History
| Year | Tax Paid | Tax Assessment Tax Assessment Total Assessment is a certain percentage of the fair market value that is determined by local assessors to be the total taxable value of land and additions on the property. | Land | Improvement |
|---|---|---|---|---|
| 2025 | $5,065 | $383,366 | $119,031 | $264,335 |
| 2023 | $5,065 | $368,481 | $114,410 | $254,071 |
| 2022 | $4,955 | $361,257 | $112,167 | $249,090 |
| 2021 | $4,807 | $354,174 | $109,968 | $244,206 |
| 2020 | $8,194 | $350,543 | $108,841 | $241,702 |
| 2019 | $8,121 | $343,670 | $106,707 | $236,963 |
| 2018 | $7,863 | $336,932 | $104,615 | $232,317 |
| 2017 | $4,347 | $330,326 | $102,564 | $227,762 |
| 2016 | $4,245 | $323,850 | $100,553 | $223,297 |
| 2015 | $4,129 | $316,486 | $99,043 | $217,443 |
| 2014 | $3,253 | $232,700 | $74,900 | $157,800 |
Source: Public Records
Map
Nearby Homes
- 5924 Walnut St
- 3844 Circle Dr
- 3955 Stonegate Ct
- 4042 Quarry Ct
- 3990 Noah Ln
- 3301 Stone Field Way
- 3293 Stone Field Way
- 3592 Colony Ln
- 5512 Sagehen Ct
- 5509 Sagehen Ct
- 6470 Arcadia Ave
- 4028 Hunter Oaks Ln
- 5403 Sandgrass Dr
- 5480 Granite Dell Ct
- 3440 Francis Dr
- 4272 Laird Rd
- 4227 Whitethorn Dr
- 6085 Arcadia Ave
- 3331 Taylor Rd
- 5769 Connie Ct
- 5930 Becky Way
- 6194 S Walnut St
- 5940 Becky Way
- 6154 S Walnut St Unit 1
- 6154 S Walnut St Unit 35
- 6154 S Walnut St Unit 16
- 6154 S Walnut St Unit 25
- 6154 S Walnut St Unit 21
- 6154 S Walnut St Unit 38
- 6154 S Walnut St Unit 41
- 6154 S Walnut St Unit 32
- 6154 S Walnut St Unit 47
- 6154 S Walnut St Unit 3
- 6154 S Walnut St Unit 31
- 6154 S Walnut St Unit 27
- 6154 S Walnut St Unit 39
- 6154 S Walnut St Unit 51
- 6154 S Walnut St Unit 14
- 6154 S Walnut St Unit 26
- 6154 S Walnut St Unit 17