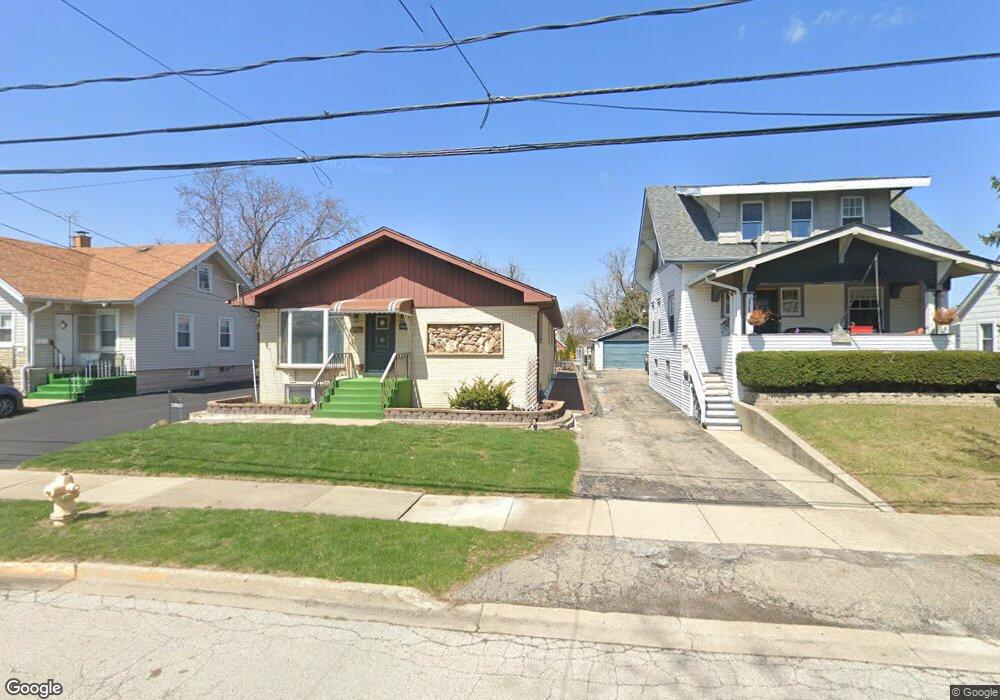
5920 W Maple Ave Berkeley, IL 60163
Estimated Value: $360,000 - $370,000
3
Beds
3
Baths
1,620
Sq Ft
$224/Sq Ft
Est. Value
About This Home
This home is located at 5920 W Maple Ave, Berkeley, IL 60163 and is currently estimated at $363,506, approximately $224 per square foot. 5920 W Maple Ave is a home located in Cook County with nearby schools including Macarthur Intermediate School, Sunnyside Elementary School, and Proviso West High School.
Ownership History
Date
Name
Owned For
Owner Type
Purchase Details
Closed on
Dec 31, 2016
Sold by
Tran Hoa Xu and Tran Thomas
Bought by
Tran Hoa X and Tran Family Trust
Current Estimated Value
Purchase Details
Closed on
Dec 5, 2005
Sold by
Baffield Ronnie
Bought by
Tran Thomas and Tran Hoaxu
Purchase Details
Closed on
Nov 2, 2004
Sold by
Baffield Ronnie and Baffield Sandra
Bought by
Baffield Ronnie
Home Financials for this Owner
Home Financials are based on the most recent Mortgage that was taken out on this home.
Original Mortgage
$266,000
Interest Rate
7.12%
Mortgage Type
New Conventional
Purchase Details
Closed on
Jan 4, 1996
Sold by
Ikemire Rudy and Cameron Joann
Bought by
Baffield Ronnie and Baffield Sandra
Home Financials for this Owner
Home Financials are based on the most recent Mortgage that was taken out on this home.
Original Mortgage
$162,000
Interest Rate
7.19%
Create a Home Valuation Report for This Property
The Home Valuation Report is an in-depth analysis detailing your home's value as well as a comparison with similar homes in the area
Home Values in the Area
Average Home Value in this Area
Purchase History
| Date | Buyer | Sale Price | Title Company |
|---|---|---|---|
| Tran Hoa X | -- | Attorney | |
| Tran Thomas | $280,000 | Git | |
| Baffield Ronnie | -- | Oconnor Title Services Inc | |
| Baffield Ronnie | $180,000 | Attorneys Natl Title Network |
Source: Public Records
Mortgage History
| Date | Status | Borrower | Loan Amount |
|---|---|---|---|
| Previous Owner | Baffield Ronnie | $266,000 | |
| Previous Owner | Baffield Ronnie | $162,000 |
Source: Public Records
Tax History
| Year | Tax Paid | Tax Assessment Tax Assessment Total Assessment is a certain percentage of the fair market value that is determined by local assessors to be the total taxable value of land and additions on the property. | Land | Improvement |
|---|---|---|---|---|
| 2025 | $9,163 | $20,852 | $4,813 | $16,039 |
| 2024 | $9,163 | $20,852 | $4,813 | $16,039 |
| 2023 | $7,423 | $28,045 | $4,813 | $23,232 |
| 2022 | $7,423 | $20,317 | $3,281 | $17,036 |
| 2021 | $8,073 | $21,764 | $3,281 | $18,483 |
| 2020 | $7,707 | $21,764 | $3,281 | $18,483 |
| 2019 | $6,299 | $18,290 | $3,062 | $15,228 |
| 2018 | $6,724 | $19,618 | $3,062 | $16,556 |
| 2017 | $6,452 | $19,618 | $3,062 | $16,556 |
| 2016 | $5,465 | $15,997 | $2,843 | $13,154 |
| 2015 | $5,398 | $15,997 | $2,843 | $13,154 |
| 2014 | $6,210 | $18,238 | $2,843 | $15,395 |
| 2013 | $5,274 | $17,034 | $2,843 | $14,191 |
Source: Public Records
Map
Nearby Homes
- 5949 School St
- 593 S Edgewood Ave
- 1428 1/2 N Ashbel Ave
- 1447 N Ashbel Ave
- 515 S Parkview Ave
- 4938 W Randolph St
- 1529 N Hillside Ave
- 5706 Saint Charles Rd
- 5700 Saint Charles Rd
- 504 N Irving Ave
- 4904 W Hawthorne Ave
- 2050 Atwood Ave
- 522 E Park Manor Ct
- 330 E Saint Charles Rd
- 605 N Wolf Rd Unit B9
- 250 N Irving Ave
- 1038 Arthur Ave
- 520 N Wolf Rd Unit 203
- 406 S Poplar Ave
- 251 E South St
- 5924 W Maple Ave
- 5916 W Maple Ave
- 5912 W Maple Ave
- 5928 W Maple Ave
- 5908 W Maple Ave
- 5921 Burr Oak Ave
- 5923 Burr Oak Ave
- 5913 Burr Oak Ave
- 5913 1/2 Burr Oak Ave
- 5923 W Maple Ave
- 5906 W Maple Ave
- 5929 Burr Oak Ave
- 5927 W Maple Ave
- 5931 W Maple Ave
- 5911 Burr Oak Ave
- 5935 Burr Oak Ave
- 5909 W Maple Ave
- 5904 W Maple Ave
- 5935 W Maple Ave
- 5907 Burr Oak Ave
Your Personal Tour Guide
Ask me questions while you tour the home.