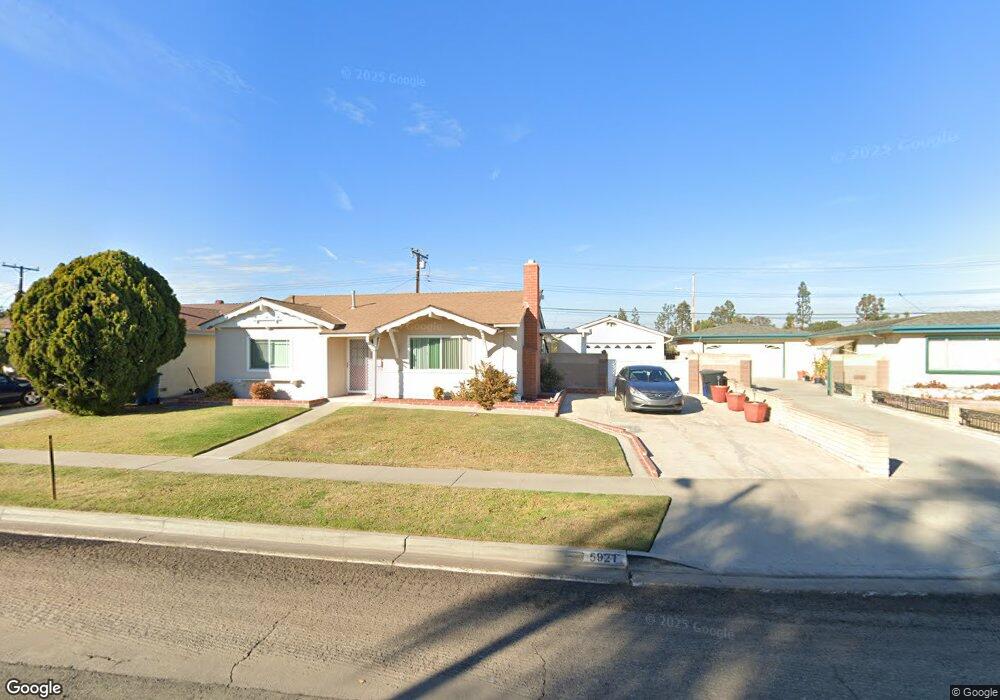
5921 Abbey Dr Westminster, CA 92683
Estimated Value: $993,000 - $1,083,771
3
Beds
2
Baths
1,340
Sq Ft
$774/Sq Ft
Est. Value
About This Home
This home is located at 5921 Abbey Dr, Westminster, CA 92683 and is currently estimated at $1,037,193, approximately $774 per square foot. 5921 Abbey Dr is a home located in Orange County with nearby schools including Sequoia Elementary, Johnson Middle, and Westminster High School.
Ownership History
Date
Name
Owned For
Owner Type
Purchase Details
Closed on
Apr 1, 2021
Sold by
Brink Kevin and The Kevin Brink Separate Prope
Bought by
Lim Caleb and Lim Lynette Tuyen
Current Estimated Value
Home Financials for this Owner
Home Financials are based on the most recent Mortgage that was taken out on this home.
Original Mortgage
$560,000
Outstanding Balance
$506,017
Interest Rate
3.05%
Mortgage Type
New Conventional
Estimated Equity
$531,176
Purchase Details
Closed on
Mar 29, 2021
Sold by
Brink Elizabeth
Bought by
Brink Kevin
Home Financials for this Owner
Home Financials are based on the most recent Mortgage that was taken out on this home.
Original Mortgage
$560,000
Outstanding Balance
$506,017
Interest Rate
3.05%
Mortgage Type
New Conventional
Estimated Equity
$531,176
Purchase Details
Closed on
Feb 1, 2018
Sold by
Brink Kevin
Bought by
Brink Kevin and The Kevin Brink Separate Property Trust
Purchase Details
Closed on
Feb 26, 2007
Sold by
Burin Anthony R and Burin Donna M
Bought by
Burin Anthony R and Burin Donna M
Create a Home Valuation Report for This Property
The Home Valuation Report is an in-depth analysis detailing your home's value as well as a comparison with similar homes in the area
Home Values in the Area
Average Home Value in this Area
Purchase History
| Date | Buyer | Sale Price | Title Company |
|---|---|---|---|
| Lim Caleb | $730,000 | Fidelity Natl Ttl Orange Cnt | |
| Brink Kevin | -- | Fidelity Natl Ttl Orange Cnt | |
| Brink Kevin | -- | None Available | |
| Brink Kevin | -- | None Available | |
| Burin Anthony R | -- | None Available |
Source: Public Records
Mortgage History
| Date | Status | Borrower | Loan Amount |
|---|---|---|---|
| Open | Lim Caleb | $560,000 |
Source: Public Records
Tax History
| Year | Tax Paid | Tax Assessment Tax Assessment Total Assessment is a certain percentage of the fair market value that is determined by local assessors to be the total taxable value of land and additions on the property. | Land | Improvement |
|---|---|---|---|---|
| 2025 | $9,229 | $790,174 | $690,038 | $100,136 |
| 2024 | $9,229 | $774,681 | $676,508 | $98,173 |
| 2023 | $8,916 | $759,492 | $663,243 | $96,249 |
| 2022 | $8,781 | $744,600 | $650,238 | $94,362 |
| 2021 | $7,673 | $641,218 | $554,846 | $86,372 |
| 2020 | $7,583 | $634,644 | $549,157 | $85,487 |
| 2019 | $7,498 | $622,200 | $538,389 | $83,811 |
| 2018 | $7,499 | $610,000 | $527,832 | $82,168 |
| 2017 | $4,309 | $341,746 | $235,907 | $105,839 |
| 2016 | $4,178 | $335,046 | $231,282 | $103,764 |
| 2015 | $4,108 | $330,014 | $227,808 | $102,206 |
| 2014 | $4,018 | $323,550 | $223,346 | $100,204 |
Source: Public Records
Map
Nearby Homes
- 5701 Norma Dr
- 13036 Springarden Ln
- 6122 Anthony Ave
- 6071 Modoc Rd
- 6091 Navajo Rd
- 6282 Cheyenne Dr
- 13722 Hammon Place
- 5382 Laverne Cir
- 5302 Clark Cir
- 6216 Hefley St Unit 3
- 13731 Claremont St
- 6141 Trinette Ave
- 13822 Marquette St
- 12586 George Reyburn Rd
- 5566 Aldershot Walk
- 12661 Saint Mark St
- 5770 Centerstone Ct
- 6751 Klondike Ave
- 6691 Killarney Ave
- 12272 Chase St
- 5931 Abbey Dr
- 5901 Abbey Dr
- 5891 Abbey Dr
- 13291 Dorfsmith Dr
- 5941 Abbey Dr
- 5912 Abbey Dr
- 5892 Abbey Dr
- 5881 Abbey Dr
- 13282 Dorfsmith Dr
- 13311 Dorfsmith Dr
- 5882 Abbey Dr
- 13292 Dorfsmith Dr
- 13322 Maychick Cir
- 5861 Abbey Dr
- 13321 Dorfsmith Dr
- 13312 Dorfsmith Dr
- 5872 Abbey Dr
- 13321 Maychick Cir
- 13332 Maychick Cir
- 5851 Abbey Dr
Your Personal Tour Guide
Ask me questions while you tour the home.