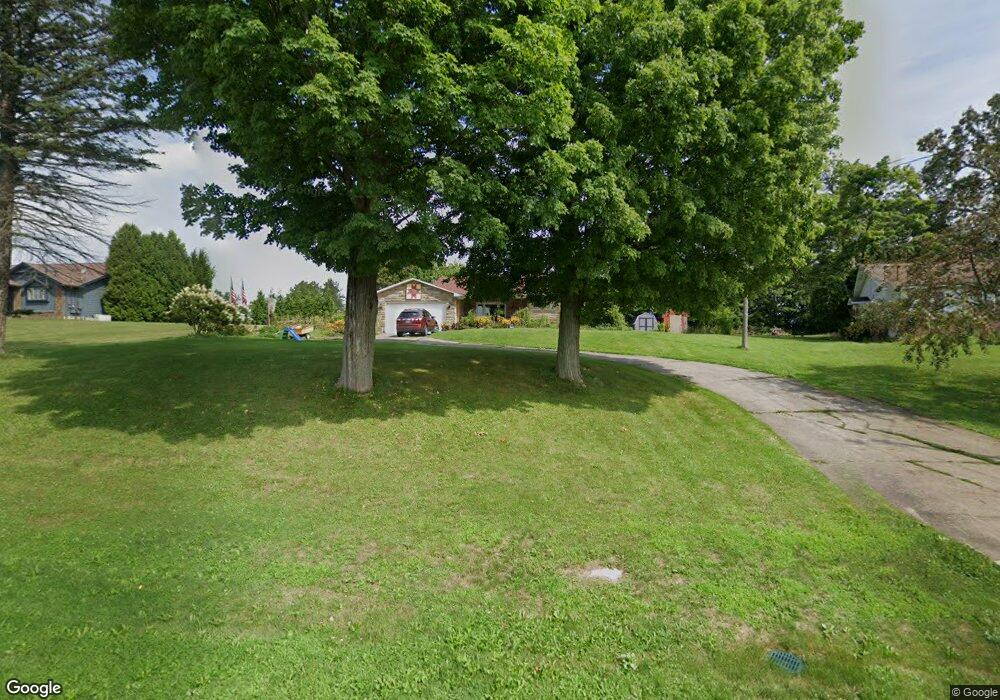
5921 Gibbs Rd Andover, OH 44003
Estimated Value: $222,601 - $323,000
3
Beds
2
Baths
1,916
Sq Ft
$139/Sq Ft
Est. Value
About This Home
This home is located at 5921 Gibbs Rd, Andover, OH 44003 and is currently estimated at $266,650, approximately $139 per square foot. 5921 Gibbs Rd is a home located in Ashtabula County with nearby schools including Pymatuning Valley Primary School, Pymatuning Valley Middle School, and Pymatuning Valley High School.
Create a Home Valuation Report for This Property
The Home Valuation Report is an in-depth analysis detailing your home's value as well as a comparison with similar homes in the area
Tax History
| Year | Tax Paid | Tax Assessment Tax Assessment Total Assessment is a certain percentage of the fair market value that is determined by local assessors to be the total taxable value of land and additions on the property. | Land | Improvement |
|---|---|---|---|---|
| 2024 | $3,623 | $61,050 | $4,240 | $56,810 |
| 2023 | $2,155 | $61,050 | $4,240 | $56,810 |
| 2022 | $1,519 | $43,830 | $3,260 | $40,570 |
| 2021 | $1,587 | $43,830 | $3,260 | $40,570 |
| 2020 | $1,588 | $43,830 | $3,260 | $40,570 |
| 2019 | $1,223 | $34,650 | $3,500 | $31,150 |
| 2018 | $1,183 | $34,650 | $3,500 | $31,150 |
| 2017 | $1,165 | $34,650 | $3,500 | $31,150 |
| 2016 | $1,155 | $33,950 | $3,430 | $30,520 |
| 2015 | $1,160 | $33,950 | $3,430 | $30,520 |
| 2014 | $1,097 | $33,950 | $3,430 | $30,520 |
| 2013 | $1,367 | $38,890 | $2,210 | $36,680 |
Source: Public Records
Map
Nearby Homes
- 5654 Chestnut St
- 143 Hickory St
- 0000 Pymatuning Blvd
- 6490 Willow Way
- 5123 4th Ave
- 6738 State Route 7
- 5378 Owen Hill Rd
- 4675 US Route 6
- 4594 Center Rd
- 5427 Slater Rd
- 5422 Slater Rd
- 1059 Clover Ln
- 6970 Williams Ave
- 1238 Hickory St
- 10820 N Lake Rd
- 1402 Hickory St
- 1416 Bass Dr
- 7868 Ohio 7
- 1256 Bass Dr
- 425 Lakeview Rd
- 5927 Gibbs Rd
- 5933 Gibbs Rd
- 6031 Gibbs Rd
- 6041 Gibbs Rd
- 6065 Gibbs Rd
- 5809 State Route 7
- 6081 Gibbs Rd
- 5869 State Route 7
- 6135 Gibbs Rd
- 5952 State Route 7
- 6159 Gibbs Rd
- 5618 S Main St
- 5966 State Route 7
- 5943 State Route 7
- 5597 State Route 7
- 5980 State Route 7
- 5961 State Route 7
- 5628 State Route 7 Unit A
- 6000 State Route 7
- 5618 State Route 7
Your Personal Tour Guide
Ask me questions while you tour the home.