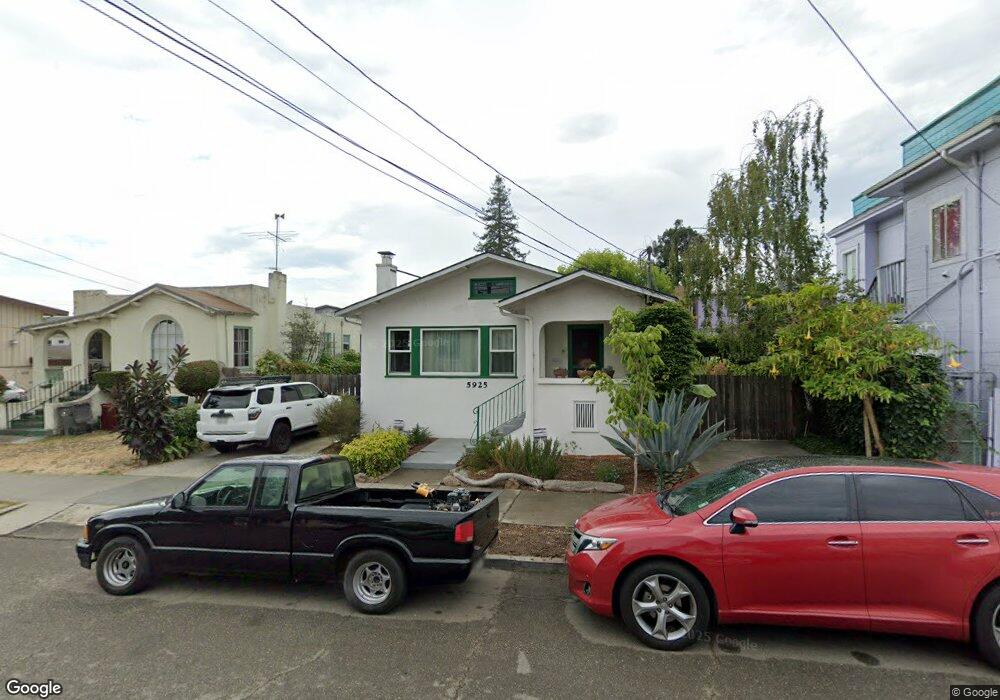
5925 Dover St Oakland, CA 94609
Santa Fe NeighborhoodEstimated Value: $1,123,000 - $1,299,000
2
Beds
3
Baths
1,408
Sq Ft
$860/Sq Ft
Est. Value
About This Home
This home is located at 5925 Dover St, Oakland, CA 94609 and is currently estimated at $1,211,166, approximately $860 per square foot. 5925 Dover St is a home located in Alameda County with nearby schools including Sankofa United Elementary School, Claremont Middle School, and Oakland Technical High School.
Ownership History
Date
Name
Owned For
Owner Type
Purchase Details
Closed on
Nov 5, 2015
Sold by
Olds Ana and Ana Olds Living Trust
Bought by
Javadiangliani Shoka and Gardi Balazs
Current Estimated Value
Home Financials for this Owner
Home Financials are based on the most recent Mortgage that was taken out on this home.
Original Mortgage
$600,000
Outstanding Balance
$472,089
Interest Rate
3.8%
Mortgage Type
New Conventional
Estimated Equity
$739,077
Purchase Details
Closed on
Mar 20, 2015
Sold by
Olds Ana
Bought by
Olds Ana and The Ana Olds Living Trust
Purchase Details
Closed on
Apr 8, 1994
Sold by
Olds Gregory L and Olds Anita S
Bought by
Olds Gregory L and Olds Anita S
Home Financials for this Owner
Home Financials are based on the most recent Mortgage that was taken out on this home.
Original Mortgage
$115,000
Interest Rate
7.38%
Create a Home Valuation Report for This Property
The Home Valuation Report is an in-depth analysis detailing your home's value as well as a comparison with similar homes in the area
Home Values in the Area
Average Home Value in this Area
Purchase History
| Date | Buyer | Sale Price | Title Company |
|---|---|---|---|
| Javadiangliani Shoka | $950,000 | Old Republic Title Company | |
| Olds Ana | -- | None Available | |
| Olds Ana | -- | None Available | |
| Olds Gregory L | $57,500 | Fidelity National Title Ins |
Source: Public Records
Mortgage History
| Date | Status | Borrower | Loan Amount |
|---|---|---|---|
| Open | Javadiangliani Shoka | $600,000 | |
| Previous Owner | Olds Gregory L | $115,000 |
Source: Public Records
Tax History Compared to Growth
Tax History
| Year | Tax Paid | Tax Assessment Tax Assessment Total Assessment is a certain percentage of the fair market value that is determined by local assessors to be the total taxable value of land and additions on the property. | Land | Improvement |
|---|---|---|---|---|
| 2025 | $15,747 | $1,117,581 | $337,374 | $787,207 |
| 2024 | $15,747 | $1,095,531 | $330,759 | $771,772 |
| 2023 | $16,619 | $1,080,918 | $324,275 | $756,643 |
| 2022 | $16,244 | $1,052,724 | $317,917 | $741,807 |
| 2021 | $15,673 | $1,031,947 | $311,684 | $727,263 |
| 2020 | $15,501 | $1,028,298 | $308,489 | $719,809 |
| 2019 | $15,008 | $1,008,140 | $302,442 | $705,698 |
| 2018 | $14,691 | $988,380 | $296,514 | $691,866 |
| 2017 | $14,162 | $969,000 | $290,700 | $678,300 |
| 2016 | $13,780 | $950,000 | $285,000 | $665,000 |
| 2015 | $2,689 | $247,949 | $62,747 | $185,202 |
| 2014 | $2,602 | $243,093 | $61,518 | $181,575 |
Source: Public Records
Map
Nearby Homes