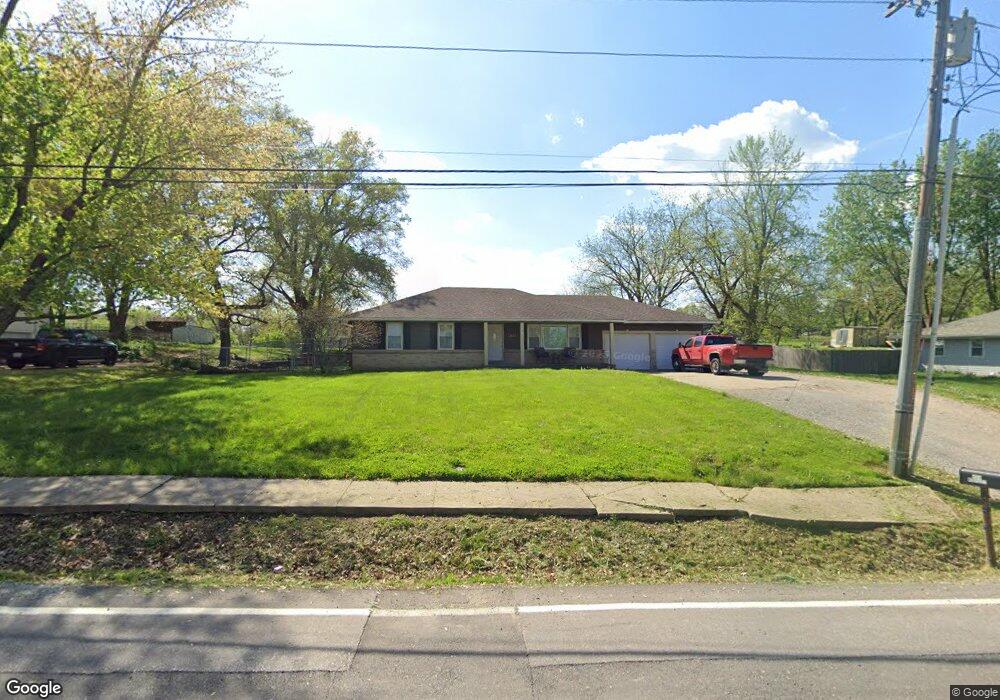
5926 Norfleet Rd Kansas City, MO 64133
Little Blue Valley NeighborhoodEstimated Value: $239,000 - $295,000
3
Beds
1
Bath
1,258
Sq Ft
$203/Sq Ft
Est. Value
About This Home
This home is located at 5926 Norfleet Rd, Kansas City, MO 64133 and is currently estimated at $255,021, approximately $202 per square foot. 5926 Norfleet Rd is a home located in Jackson County with nearby schools including Norfleet Elementary School, Raytown Central Middle School, and Raytown South High School.
Ownership History
Date
Name
Owned For
Owner Type
Purchase Details
Closed on
Jul 30, 2010
Sold by
Secretary Of Housing & Urban Development
Bought by
Bowlen Donald R
Current Estimated Value
Home Financials for this Owner
Home Financials are based on the most recent Mortgage that was taken out on this home.
Original Mortgage
$30,600
Outstanding Balance
$10,192
Interest Rate
4.69%
Mortgage Type
New Conventional
Estimated Equity
$244,829
Purchase Details
Closed on
Feb 2, 2010
Sold by
Chase Home Finance Llc
Bought by
Secretary Of Housing & Urban Development
Purchase Details
Closed on
Jan 25, 2010
Sold by
Yearout Ryan A and Yearout Cori M
Bought by
Chase Home Finance Llc
Purchase Details
Closed on
Nov 20, 2001
Sold by
Yearout Olive Mildred
Bought by
Yearout Ryan A and Yearout Cori M
Home Financials for this Owner
Home Financials are based on the most recent Mortgage that was taken out on this home.
Original Mortgage
$78,570
Interest Rate
6.54%
Mortgage Type
Purchase Money Mortgage
Purchase Details
Closed on
Jul 29, 1998
Sold by
Yearout Olive Mildred
Bought by
Yearout Paul Dean and Yearout Bobby Gene
Create a Home Valuation Report for This Property
The Home Valuation Report is an in-depth analysis detailing your home's value as well as a comparison with similar homes in the area
Home Values in the Area
Average Home Value in this Area
Purchase History
| Date | Buyer | Sale Price | Title Company |
|---|---|---|---|
| Bowlen Donald R | -- | Northwest Title Agency Inc | |
| Secretary Of Housing & Urban Development | -- | Continental Title Company | |
| Chase Home Finance Llc | $157,208 | Continental Title Company | |
| Yearout Ryan A | -- | Chicago Title Co | |
| Yearout Paul Dean | -- | -- |
Source: Public Records
Mortgage History
| Date | Status | Borrower | Loan Amount |
|---|---|---|---|
| Open | Bowlen Donald R | $30,600 | |
| Previous Owner | Yearout Ryan A | $78,570 |
Source: Public Records
Tax History Compared to Growth
Tax History
| Year | Tax Paid | Tax Assessment Tax Assessment Total Assessment is a certain percentage of the fair market value that is determined by local assessors to be the total taxable value of land and additions on the property. | Land | Improvement |
|---|---|---|---|---|
| 2025 | $2,922 | $35,179 | $12,863 | $22,316 |
| 2024 | $2,922 | $32,281 | $19,329 | $12,952 |
| 2023 | $2,903 | $32,281 | $8,267 | $24,014 |
| 2022 | $2,489 | $26,600 | $8,531 | $18,069 |
| 2021 | $2,488 | $26,600 | $8,531 | $18,069 |
| 2020 | $2,403 | $25,385 | $8,531 | $16,854 |
| 2019 | $2,358 | $25,385 | $8,531 | $16,854 |
| 2018 | $2,011 | $21,740 | $3,603 | $18,137 |
| 2017 | $1,947 | $21,740 | $3,603 | $18,137 |
| 2016 | $1,947 | $21,196 | $5,871 | $15,325 |
| 2014 | $1,727 | $18,734 | $5,700 | $13,034 |
Source: Public Records
Map
Nearby Homes
- 6022 Norfleet Rd
- 6009 Marion Ave
- 12505 E 58th Terrace
- 5923 Larson Ave
- 12915 E 58th St
- 12417 E 58th Terrace
- 12724 E 63rd St
- 6012 Woodside Ave
- 11918 E 59th St
- 11914 E 59th Terrace
- 12108 E 57th Terrace
- 12005 E 57th Terrace
- 12101 E 65th Ct
- 11715 E 60th St
- 13601 E 55th Terrace
- 11707 E 60th Terrace
- 12909 E 54th Terrace
- 11701 E 61st St
- 11913 E 57th St
- 11600 E 62nd St
- 5924 Norfleet Rd
- 6018 Norfleet Rd
- 5922 Norfleet Rd
- 6003 Norfleet Rd
- 6024 Norfleet Rd
- 12709 E 59th Terrace
- 12701 E 59th Terrace
- 12609 E 59th Terrace
- 5915 Norfleet Rd
- 12710 E 59th Terrace
- 12700 E 59th Terrace
- 12605 E 59th Terrace
- 6101 Norfleet Rd
- 12708 E 59th Terrace
- 12606 E 59th Terrace
- 12601 E 59th Terrace
- 5911 Norfleet Rd
- 12901 E 61st St
- 12604 E 59th Terrace
- 12821 E 59th Terrace