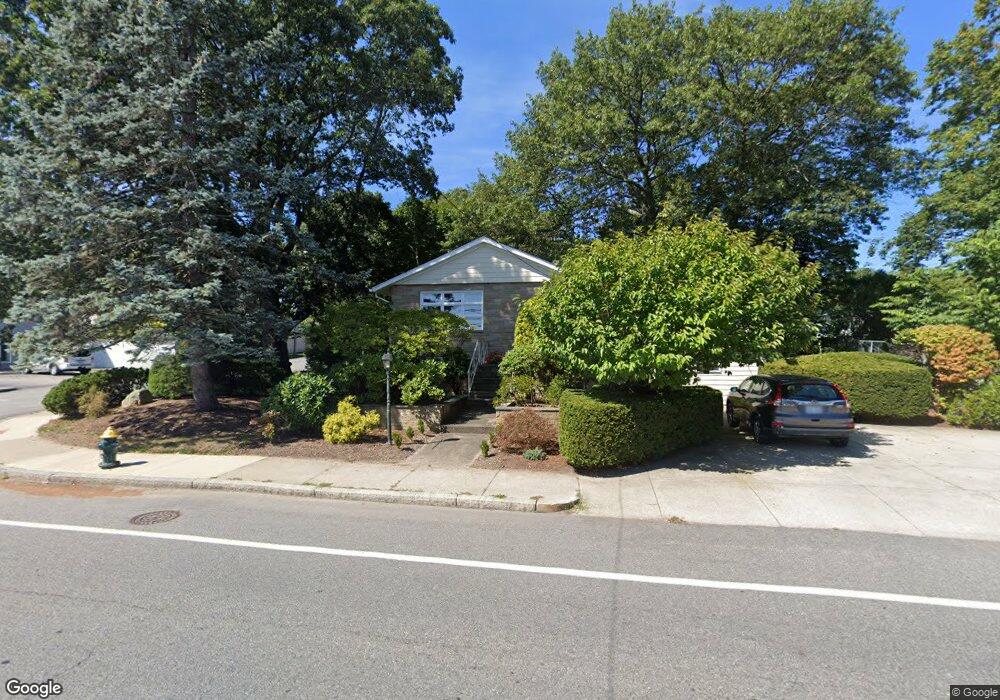
593 Budlong Rd Cranston, RI 02920
Meshanticut NeighborhoodEstimated Value: $452,376 - $925,000
5
Beds
2
Baths
2,512
Sq Ft
$236/Sq Ft
Est. Value
About This Home
This home is located at 593 Budlong Rd, Cranston, RI 02920 and is currently estimated at $591,844, approximately $235 per square foot. 593 Budlong Rd is a home located in Providence County with nearby schools including Woodridge Elementary School, Western Hills Middle School, and Cranston High School West.
Ownership History
Date
Name
Owned For
Owner Type
Purchase Details
Closed on
Jan 16, 2009
Sold by
Baldoni Marilyn C
Bought by
Sun Chanqui and Zhao Weiping
Current Estimated Value
Home Financials for this Owner
Home Financials are based on the most recent Mortgage that was taken out on this home.
Original Mortgage
$241,808
Interest Rate
5.52%
Mortgage Type
Purchase Money Mortgage
Create a Home Valuation Report for This Property
The Home Valuation Report is an in-depth analysis detailing your home's value as well as a comparison with similar homes in the area
Home Values in the Area
Average Home Value in this Area
Purchase History
| Date | Buyer | Sale Price | Title Company |
|---|---|---|---|
| Sun Chanqui | $245,000 | -- |
Source: Public Records
Mortgage History
| Date | Status | Borrower | Loan Amount |
|---|---|---|---|
| Open | Sun Chanqui | $100,000 | |
| Closed | Sun Chanqui | $19,100 | |
| Closed | Sun Chanqui | $194,000 | |
| Closed | Sun Chanqui | $241,808 |
Source: Public Records
Tax History Compared to Growth
Tax History
| Year | Tax Paid | Tax Assessment Tax Assessment Total Assessment is a certain percentage of the fair market value that is determined by local assessors to be the total taxable value of land and additions on the property. | Land | Improvement |
|---|---|---|---|---|
| 2025 | $5,359 | $386,100 | $100,800 | $285,300 |
| 2024 | $5,255 | $386,100 | $100,800 | $285,300 |
| 2023 | $5,058 | $267,600 | $69,500 | $198,100 |
| 2022 | $4,953 | $267,600 | $69,500 | $198,100 |
| 2021 | $4,817 | $267,600 | $69,500 | $198,100 |
| 2020 | $4,835 | $232,800 | $54,100 | $178,700 |
| 2019 | $4,835 | $232,800 | $54,100 | $178,700 |
| 2018 | $4,724 | $232,800 | $54,100 | $178,700 |
| 2017 | $4,813 | $209,800 | $42,500 | $167,300 |
| 2016 | $4,710 | $209,800 | $42,500 | $167,300 |
| 2015 | $4,710 | $209,800 | $42,500 | $167,300 |
| 2014 | $4,013 | $175,700 | $42,500 | $133,200 |
Source: Public Records
Map
Nearby Homes
- 141 Glen Ridge Rd
- 10 Sheffield Rd
- 446 Budlong Rd
- 28 Hybrid Dr
- 46 Lilyana Way
- 275 Meshanticut Valley Pkwy
- 51 E Bel Air Rd
- 0 Rutland St
- 200 Hoffman Ave Unit 505
- 45 Hamden Rd
- 145 E Hill Dr
- 69 W View Ave
- 132 Fordson Ave Unit 12
- 34 Keller Ave
- 189 Summit Dr
- 132 Hoffman Ave Unit 115
- 132 Hoffman Ave Unit 207
- 132 Hoffman Ave Unit 110
- 99 Salem Ave
- 143 Hoffman Ave Unit 109