593 Chandon Ct Walnut Creek, CA 94597
Contra Costa Centre NeighborhoodEstimated Value: $741,802 - $948,000
About This Home
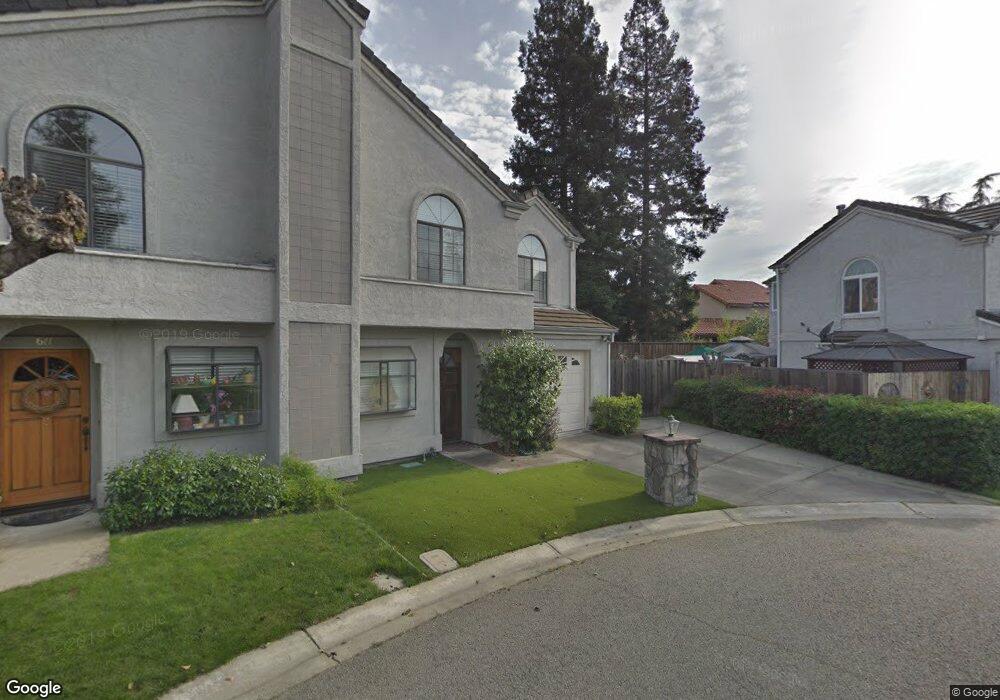
This home is located at 593 Chandon Ct, Walnut Creek, CA 94597 and is currently estimated at $803,701, approximately $579 per square foot. 593 Chandon Ct is a home located in Contra Costa County with nearby schools including Buena Vista Elementary School, Walnut Creek Intermediate School, and Las Lomas High School.
Ownership History
We collect this data history from publicly available records. To have your information removed, we recommend requesting removal directly through your county’s website.
Purchase Details
Home Financials for this Owner
Home Financials are based on the most recent Mortgage that was taken out on this home.Purchase Details
Home Financials for this Owner
Home Financials are based on the most recent Mortgage that was taken out on this home.Purchase Details
Home Financials for this Owner
Home Financials are based on the most recent Mortgage that was taken out on this home.Purchase Details
Home Financials for this Owner
Home Financials are based on the most recent Mortgage that was taken out on this home.Purchase Details
Home Values in the Area
Average Home Value in this Area
Purchase History
We collect this data history from publicly available records. To have your information removed, we recommend requesting removal directly through your county’s website.
| Date | Buyer | Sale Price | Title Company |
|---|---|---|---|
| $410,000 | Old Republic Title Company | ||
| -- | Financial Title Company | ||
| -- | Chicago Title | ||
| -- | Chicago Title | ||
| $355,000 | American Title Co | ||
| $260,000 | Placer Title Company |
Mortgage History
We collect this data history from publicly available records. To have your information removed, we recommend requesting removal directly through your county’s website.
| Date | Status | Borrower | Loan Amount |
|---|---|---|---|
| Open | $216,306 | ||
| Closed | $241,000 | ||
| Closed | $244,000 | ||
| Closed | $246,000 | ||
| Previous Owner | $100,000 | ||
| Previous Owner | $462,000 | ||
| Previous Owner | $452,000 | ||
| Previous Owner | $50,000 | ||
| Previous Owner | $355,000 | ||
| Previous Owner | $284,000 |
Tax History
We collect this data history from publicly available records. To have your information removed, we recommend requesting removal directly through your county’s website.
| Year | Tax Paid | Tax Assessment Tax Assessment Total Assessment is a certain percentage of the fair market value that is determined by local assessors to be the total taxable value of land and additions on the property. | Land | Improvement |
|---|---|---|---|---|
| 2026 | $6,621 | $512,645 | $425,125 | $87,520 |
| 2025 | $6,621 | $502,594 | $416,790 | $85,804 |
| 2024 | $6,366 | $492,740 | $408,618 | $84,122 |
| 2023 | $6,366 | $483,079 | $400,606 | $82,473 |
| 2022 | $6,235 | $473,607 | $392,751 | $80,856 |
| 2021 | $6,066 | $464,321 | $385,050 | $79,271 |
| 2019 | $5,921 | $450,551 | $373,630 | $76,921 |
| 2018 | $5,723 | $441,717 | $366,304 | $75,413 |
| 2017 | $5,608 | $433,057 | $359,122 | $73,935 |
| 2016 | $5,492 | $424,567 | $352,081 | $72,486 |
| 2015 | $5,362 | $418,191 | $346,793 | $71,398 |
| 2014 | $5,289 | $410,000 | $340,000 | $70,000 |
Map
- 1409 Walden Rd
- 470 N Civic Dr Unit 505
- 535 Churchill Downs Ct
- 114 Oak Rd
- 112 Oak Rd
- 582 Pimlico Ct
- 460 N Civic Dr Unit 311
- 440 N Civic Dr Unit 203
- 460 N Civic Dr Unit 106
- 430 N Civic Dr Unit 310
- 420 N Civic Dr Unit 207
- 440 N Civic Dr Unit 105
- 460 N Civic Dr Unit 302
- 460 N Civic Dr Unit 301
- 440 N Civic Dr Unit 201
- 512 Churchill Downs Ct Unit Y250
- 490 N Civic Dr Unit 101
- 531 Pimlico Ct Unit 3
- 1310 Walden Rd Unit 11
- 1308 Walden Rd Unit 27
- 387 Pimlico Dr
- 391 Pimlico Dr
- 385 Pimlico Dr Unit 161
- 383 Pimlico Dr Unit 162
- 381 Pimlico Dr
- 405 Pimlico Dr Unit 166
- 403 Pimlico Dr
- 369 Pimlico Dr
- 401 Pimlico Dr
- 371 Pimlico Dr
- 180 Shady Ln
- 205 Shady Ln
- 160 Shady Ln
- 367 Pimlico Dr
- 413 Pimlico Dr Unit 171
- 161 Shady Ln Unit 1
- 161 Shady Ln
- 411 Pimlico Dr
- 400 Pimlico Dr
- 415 Pimlico Dr
Ask me questions while you tour the home.