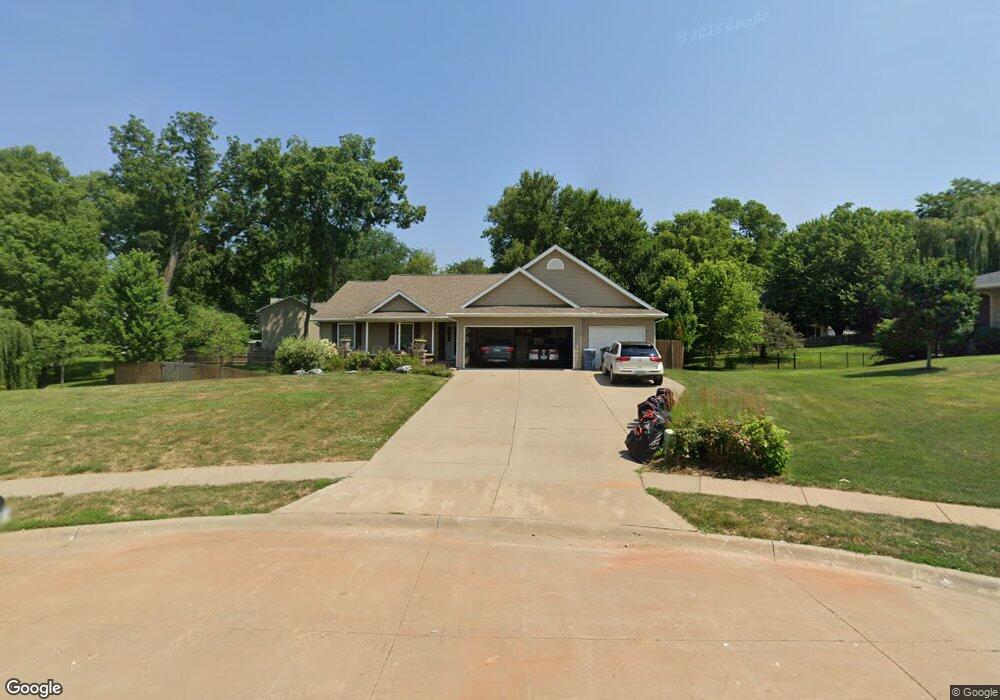
593 Clover Hill Ln Le Claire, IA 52753
Estimated Value: $363,000 - $472,000
3
Beds
2
Baths
1,575
Sq Ft
$266/Sq Ft
Est. Value
About This Home
This home is located at 593 Clover Hill Ln, Le Claire, IA 52753 and is currently estimated at $418,745, approximately $265 per square foot. 593 Clover Hill Ln is a home located in Scott County with nearby schools including Bridgeview Elementary School, Pleasant Valley Junior High School, and Pleasant Valley High School.
Ownership History
Date
Name
Owned For
Owner Type
Purchase Details
Closed on
May 10, 2013
Sold by
Crosby Darin D and Crosby Kimberly B
Bought by
Crosby Darin D and Crosby Kimberly B
Current Estimated Value
Purchase Details
Closed on
Oct 1, 2009
Sold by
Costello James V and Costello Maura
Bought by
Crosby Darin D and Crosby Kimberly B
Home Financials for this Owner
Home Financials are based on the most recent Mortgage that was taken out on this home.
Original Mortgage
$22,500
Interest Rate
5.15%
Mortgage Type
New Conventional
Purchase Details
Closed on
Oct 25, 2007
Sold by
Finca International Inc
Bought by
Costello James and Costello Maura
Purchase Details
Closed on
Jun 19, 2007
Sold by
Stevens Richard L
Bought by
Finca International Inc
Purchase Details
Closed on
Feb 26, 2007
Sold by
Wolf Run Llc
Bought by
Stevens Richard L
Create a Home Valuation Report for This Property
The Home Valuation Report is an in-depth analysis detailing your home's value as well as a comparison with similar homes in the area
Home Values in the Area
Average Home Value in this Area
Purchase History
| Date | Buyer | Sale Price | Title Company |
|---|---|---|---|
| Crosby Darin D | -- | None Available | |
| Crosby Darin D | $30,000 | None Available | |
| Costello James | $19,000 | None Available | |
| Finca International Inc | -- | None Available | |
| Stevens Richard L | $65,000 | None Available |
Source: Public Records
Mortgage History
| Date | Status | Borrower | Loan Amount |
|---|---|---|---|
| Closed | Crosby Darin D | $22,500 |
Source: Public Records
Tax History Compared to Growth
Tax History
| Year | Tax Paid | Tax Assessment Tax Assessment Total Assessment is a certain percentage of the fair market value that is determined by local assessors to be the total taxable value of land and additions on the property. | Land | Improvement |
|---|---|---|---|---|
| 2025 | $5,548 | $394,500 | $92,500 | $302,000 |
| 2024 | $5,632 | $375,800 | $92,500 | $283,300 |
| 2023 | $5,556 | $375,800 | $92,500 | $283,300 |
| 2022 | $5,498 | $314,310 | $68,810 | $245,500 |
| 2021 | $5,498 | $314,310 | $68,810 | $245,500 |
| 2020 | $5,214 | $292,960 | $62,400 | $230,560 |
| 2019 | $5,058 | $269,820 | $62,400 | $207,420 |
| 2018 | $4,998 | $269,820 | $62,400 | $207,420 |
| 2017 | $1,501 | $269,820 | $62,400 | $207,420 |
| 2016 | $4,770 | $0 | $0 | $0 |
| 2015 | $4,770 | $0 | $0 | $0 |
| 2014 | $4,548 | $0 | $0 | $0 |
| 2013 | $4,454 | $0 | $0 | $0 |
| 2012 | -- | $234,050 | $62,400 | $171,650 |
Source: Public Records
Map
Nearby Homes
- 595 Clover Hill Ln
- 501 Fairwynd Dr
- 591 Clover Hill Ln
- 590 Clover Hill Ln
- 598 Clover Hill Ln
- 525 Mississippi Terrace
- 597 Clover Hill Ln
- 515 Mississippi Terrace
- 535 Mississippi Terrace
- 596 Clover Hill Ln
- 501 Mississippi Terrace
- 543 Mississippi Terrace
- 411 Fairwynd Dr
- 693 Clover Hill Ln
- 692 Clover Hill Ln
- 601 Mississippi Terrace
- 437 Mississippi Terrace
- 630 S Cody Rd
- 409 Fairwynd Dr
- 624 S Cody Rd