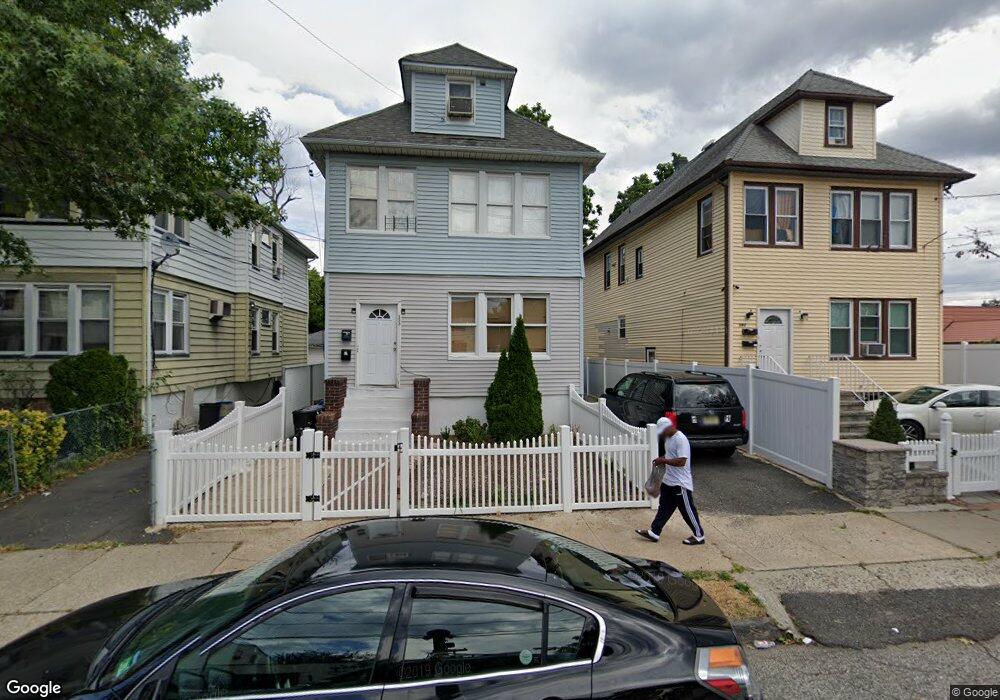
593 E 38th St Unit 597 Paterson, NJ 07513
Eastside NeighborhoodEstimated Value: $616,000 - $730,000
4
Beds
2
Baths
2,384
Sq Ft
$273/Sq Ft
Est. Value
About This Home
This home is located at 593 E 38th St Unit 597, Paterson, NJ 07513 and is currently estimated at $650,061, approximately $272 per square foot. 593 E 38th St Unit 597 is a home located in Passaic County with nearby schools including Dale Avenue Elementary School, Edward W. Kilpatrick School of Discovery, and Paterson School 6.
Ownership History
Date
Name
Owned For
Owner Type
Purchase Details
Closed on
Mar 28, 2018
Sold by
Delara David
Bought by
Hiciano Jimene Z Joel C and Hiciano Sairay Y
Current Estimated Value
Home Financials for this Owner
Home Financials are based on the most recent Mortgage that was taken out on this home.
Original Mortgage
$305,367
Outstanding Balance
$262,975
Interest Rate
4.5%
Mortgage Type
FHA
Estimated Equity
$387,086
Purchase Details
Closed on
May 31, 2016
Sold by
Diaz Doris
Bought by
Delara David
Home Financials for this Owner
Home Financials are based on the most recent Mortgage that was taken out on this home.
Original Mortgage
$197,206
Interest Rate
3.5%
Mortgage Type
FHA
Purchase Details
Closed on
Jun 23, 2003
Sold by
Rivera Wendel
Bought by
Diaz Doris
Home Financials for this Owner
Home Financials are based on the most recent Mortgage that was taken out on this home.
Original Mortgage
$255,982
Interest Rate
5.46%
Mortgage Type
FHA
Create a Home Valuation Report for This Property
The Home Valuation Report is an in-depth analysis detailing your home's value as well as a comparison with similar homes in the area
Home Values in the Area
Average Home Value in this Area
Purchase History
| Date | Buyer | Sale Price | Title Company |
|---|---|---|---|
| Hiciano Jimene Z Joel C | $311,000 | Valley National Title Svcs | |
| Delara David | $202,815 | None Available | |
| Diaz Doris | $260,000 | -- |
Source: Public Records
Mortgage History
| Date | Status | Borrower | Loan Amount |
|---|---|---|---|
| Open | Hiciano Jimene Z Joel C | $305,367 | |
| Previous Owner | Delara David | $197,206 | |
| Previous Owner | Diaz Doris | $255,982 |
Source: Public Records
Tax History Compared to Growth
Tax History
| Year | Tax Paid | Tax Assessment Tax Assessment Total Assessment is a certain percentage of the fair market value that is determined by local assessors to be the total taxable value of land and additions on the property. | Land | Improvement |
|---|---|---|---|---|
| 2025 | $13,436 | $263,700 | $47,900 | $215,800 |
| 2024 | $14,155 | $263,700 | $47,900 | $215,800 |
| 2022 | $13,401 | $288,700 | $47,900 | $240,800 |
| 2021 | $12,922 | $288,700 | $47,900 | $240,800 |
| 2020 | $12,053 | $288,700 | $47,900 | $240,800 |
| 2019 | $11,600 | $280,600 | $47,000 | $233,600 |
| 2018 | $9,085 | $210,000 | $46,500 | $163,500 |
| 2017 | $8,665 | $208,300 | $46,100 | $162,200 |
| 2016 | $9,181 | $211,600 | $40,200 | $171,400 |
| 2015 | $8,693 | $211,600 | $40,200 | $171,400 |
| 2014 | $9,860 | $340,000 | $158,400 | $181,600 |
Source: Public Records
Map
Nearby Homes
- 577 E 38th St Unit 1
- 310-312 Vreeland Ave
- 310 Vreeland Ave Unit 312
- 291 Maryland Ave Unit 295
- 224-226 Vreeland Ave
- 248 22nd Ave
- 693-695 E 31st St
- 693 E 31st St Unit 695
- 707 E 30th St Unit 711
- 405 E 40th St Unit 407
- 275 19th Ave Unit 277
- 275-277 19th Ave
- 393-395 E 38th St
- 393 E 38th St Unit 395
- 156 Kentucky Ave Unit 158
- 471-473 E 31st St
- 471 E 31st St Unit 473
- 143 Wabash Ave Unit 145
- 350 Trenton Ave Unit 352
- 336 E 41st St Unit 338
- 593-597 E 38th St
- 597-599 E 38th St
- 591 E 38th St Unit 593
- 597 E 38th St Unit 599
- 597 E 38th St Unit 2
- 589 E 38th St Unit 591
- 591-593 E 38th St
- 585-589 E 38th St
- 585 E 38th St Unit 589
- 989-1003 Market St
- 592 E 39th St Unit 594
- 590 E 39th St Unit 592
- 583 E 38th St Unit 585
- 590 E 38th St Unit 592
- 588-590 E 39th St
- 590-592 E 38th St
- 581 E 38th St Unit 583
- 588 E 39th St Unit 590
- 584 E 39th St Unit 588
- 586 E 38th St