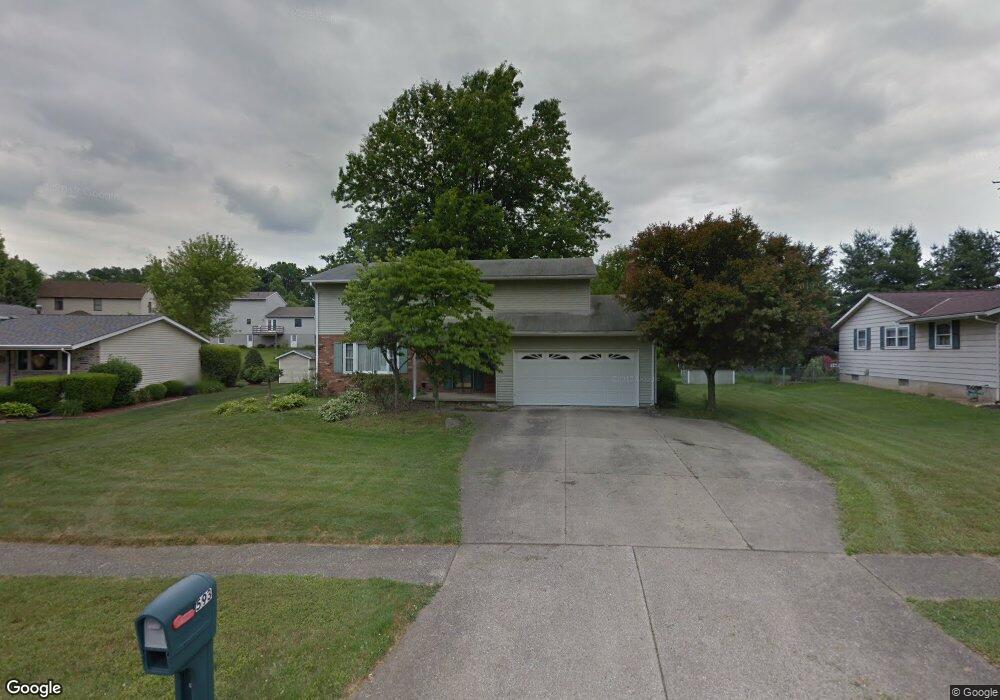
593 Sequoia Ln Mansfield, OH 44904
Estimated Value: $275,000 - $307,000
4
Beds
3
Baths
2,240
Sq Ft
$128/Sq Ft
Est. Value
About This Home
This home is located at 593 Sequoia Ln, Mansfield, OH 44904 and is currently estimated at $287,155, approximately $128 per square foot. 593 Sequoia Ln is a home located in Richland County with nearby schools including Lexington High School, Mansfield Christian School, and Discovery School.
Ownership History
Date
Name
Owned For
Owner Type
Purchase Details
Closed on
Aug 29, 2018
Sold by
Shade James C and Shade Deborah W
Bought by
Young Kevin C and Young Alyson
Current Estimated Value
Home Financials for this Owner
Home Financials are based on the most recent Mortgage that was taken out on this home.
Original Mortgage
$150,000
Outstanding Balance
$130,539
Interest Rate
4.5%
Mortgage Type
VA
Estimated Equity
$156,616
Purchase Details
Closed on
May 24, 2013
Sold by
Deutsche Bank National Trust Company
Bought by
Shade James C and Shade Deborah W
Purchase Details
Closed on
Feb 5, 2013
Sold by
Beall Dale B
Bought by
Deutsche Bank National Trust Company
Purchase Details
Closed on
Sep 28, 2006
Sold by
Burns Kevin M
Bought by
Beall Ii Dale B
Home Financials for this Owner
Home Financials are based on the most recent Mortgage that was taken out on this home.
Original Mortgage
$150,250
Interest Rate
6.58%
Mortgage Type
Purchase Money Mortgage
Create a Home Valuation Report for This Property
The Home Valuation Report is an in-depth analysis detailing your home's value as well as a comparison with similar homes in the area
Home Values in the Area
Average Home Value in this Area
Purchase History
| Date | Buyer | Sale Price | Title Company |
|---|---|---|---|
| Young Kevin C | $150,000 | Chicago Title | |
| Shade James C | $96,500 | Chicago Title Agency Of Mari | |
| Deutsche Bank National Trust Company | $68,000 | None Available | |
| Beall Ii Dale B | $150,250 | None Available |
Source: Public Records
Mortgage History
| Date | Status | Borrower | Loan Amount |
|---|---|---|---|
| Open | Young Kevin C | $150,000 | |
| Previous Owner | Beall Ii Dale B | $150,250 |
Source: Public Records
Tax History Compared to Growth
Tax History
| Year | Tax Paid | Tax Assessment Tax Assessment Total Assessment is a certain percentage of the fair market value that is determined by local assessors to be the total taxable value of land and additions on the property. | Land | Improvement |
|---|---|---|---|---|
| 2024 | $3,513 | $71,830 | $15,870 | $55,960 |
| 2023 | $3,513 | $71,830 | $15,870 | $55,960 |
| 2022 | $3,082 | $54,250 | $11,990 | $42,260 |
| 2021 | $3,092 | $54,250 | $11,990 | $42,260 |
| 2020 | $3,095 | $54,250 | $11,990 | $42,260 |
| 2019 | $2,844 | $45,970 | $10,160 | $35,810 |
| 2018 | $2,420 | $45,970 | $10,160 | $35,810 |
| 2017 | $2,394 | $45,970 | $10,160 | $35,810 |
| 2016 | $2,512 | $47,290 | $9,850 | $37,440 |
| 2015 | $2,512 | $47,290 | $9,850 | $37,440 |
| 2014 | $2,510 | $47,290 | $9,850 | $37,440 |
| 2012 | $2,439 | $48,760 | $10,160 | $38,600 |
Source: Public Records
Map
Nearby Homes
- 1928 Middle Bellville Rd
- 591 Straub Rd W
- 531 Sequoia Ln
- 615 Bailey Dr
- 601 Karlson Dr
- 1915 Red Oak Dr
- 1790 Rippling Brook Dr
- 2055 Random Dr
- 1702 Middle Bellville Rd
- 763 York St W
- 1720 Rippling Brook Dr
- 1690 Emerson Dr
- 0 Rippling Brook Dr
- 1840 Blue Cedar Dr
- 2123 Random Dr
- 1696 Riva Ridge Dr
- 1690 Riva Ridge Dr Unit 1690
- 710 Cloverleaf Ct
- 1011 Princeton Trace
- 823 1/2 Red Oak Trail