593 W Sutton Cir Lafayette, CO 80026
Estimated Value: $710,000 - $855,000
3
Beds
3
Baths
2,069
Sq Ft
$384/Sq Ft
Est. Value
About This Home
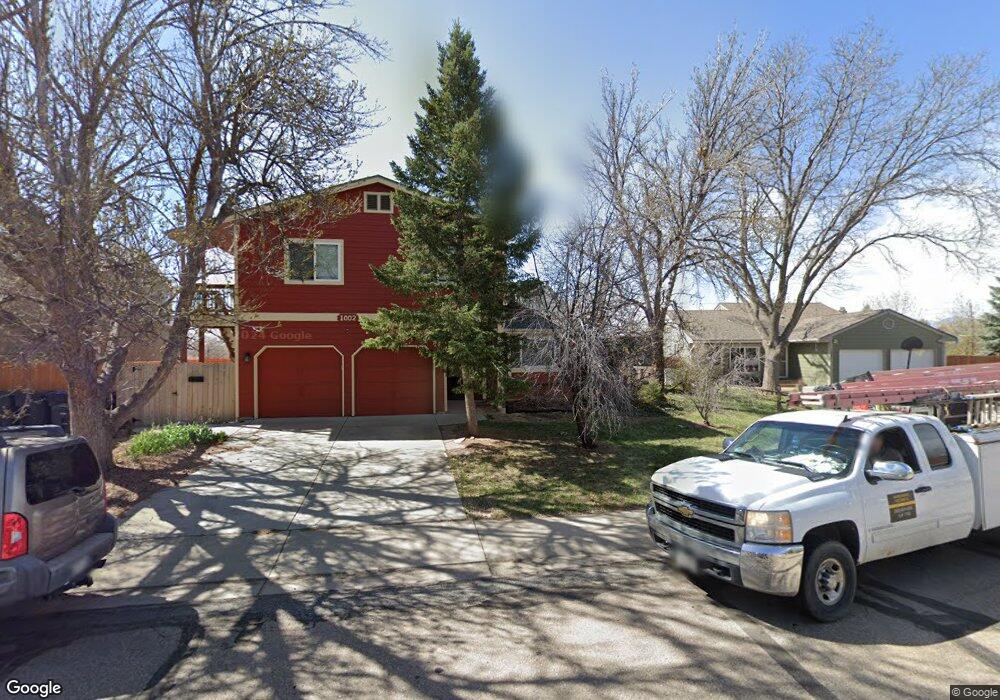
This home is located at 593 W Sutton Cir, Lafayette, CO 80026 and is currently estimated at $795,129, approximately $384 per square foot. 593 W Sutton Cir is a home located in Boulder County with nearby schools including Lafayette Elementary School, Angevine Middle School, and Centaurus High School.
Ownership History
Date
Name
Owned For
Owner Type
Purchase Details
Closed on
Aug 29, 2007
Sold by
The Everett R & Yolanda Tafoya Joint Liv
Bought by
Tafoya Yolanda
Current Estimated Value
Purchase Details
Closed on
Jun 29, 2003
Sold by
Tafoya Everett R and Tafoya Yolanda
Bought by
Everett R & Yolanda Tafoya Joint Living
Purchase Details
Closed on
Dec 4, 1995
Sold by
Tafoya Everett R
Bought by
Tafoya Everett
Home Financials for this Owner
Home Financials are based on the most recent Mortgage that was taken out on this home.
Original Mortgage
$108,750
Interest Rate
7.4%
Purchase Details
Closed on
Nov 17, 1989
Bought by
Tafoya Yolanda
Purchase Details
Closed on
May 31, 1984
Bought by
Tafoya Yolanda
Purchase Details
Closed on
Dec 23, 1981
Bought by
Tafoya Yolanda
Create a Home Valuation Report for This Property
The Home Valuation Report is an in-depth analysis detailing your home's value as well as a comparison with similar homes in the area
Home Values in the Area
Average Home Value in this Area
Purchase History
| Date | Buyer | Sale Price | Title Company |
|---|---|---|---|
| Tafoya Yolanda | -- | None Available | |
| Everett R & Yolanda Tafoya Joint Living | -- | -- | |
| Tafoya Everett | -- | Commonwealth Land Title | |
| Tafoya Yolanda | $85,300 | -- | |
| Tafoya Yolanda | $98,500 | -- | |
| Tafoya Yolanda | $84,200 | -- |
Source: Public Records
Mortgage History
| Date | Status | Borrower | Loan Amount |
|---|---|---|---|
| Previous Owner | Tafoya Everett | $108,750 |
Source: Public Records
Tax History Compared to Growth
Tax History
| Year | Tax Paid | Tax Assessment Tax Assessment Total Assessment is a certain percentage of the fair market value that is determined by local assessors to be the total taxable value of land and additions on the property. | Land | Improvement |
|---|---|---|---|---|
| 2025 | $4,483 | $49,131 | $13,056 | $36,075 |
| 2024 | $4,483 | $49,131 | $13,056 | $36,075 |
| 2023 | $4,407 | $50,598 | $16,810 | $37,473 |
| 2022 | $2,996 | $31,894 | $11,808 | $20,086 |
| 2021 | $2,963 | $32,812 | $12,148 | $20,664 |
| 2020 | $2,799 | $30,631 | $10,296 | $20,335 |
| 2019 | $2,761 | $30,631 | $10,296 | $20,335 |
| 2018 | $2,527 | $27,684 | $8,928 | $18,756 |
| 2017 | $2,461 | $30,606 | $9,870 | $20,736 |
| 2016 | $2,102 | $22,893 | $7,801 | $15,092 |
| 2015 | $1,969 | $18,364 | $5,254 | $13,110 |
| 2014 | $1,588 | $18,364 | $5,254 | $13,110 |
Source: Public Records
Map
Nearby Homes
- 490 E Sutton Cir
- 655 N Gooseberry Ct
- 880 Orion Dr
- 372 S Carr Ave
- 1140 Dorset Ct
- 718 Julian Cir
- 1125 Somerset St
- 725 Julian Cir
- 925 Sparta Dr
- 911 Homer Cir
- 1140 Devonshire Ct
- 1160 Devonshire Ct
- 200 S Carr Ave
- 805 Argos Cir
- 924 Milo Cir Unit A
- 998 Milo Cir Unit A
- 1091 Milo Cir Unit B
- 403 W Cannon St
- 1045 Milo Cir Unit A
- 1068 Milo Cir Unit A
- 1004 Keystone Ct
- 1002 Keystone Ct
- 1000 Keystone Ct
- 1006 Keystone Ct
- 745 Silverberry Ct
- 580 W Sutton Cir
- 1007 Keystone Ct
- 1003 Keystone Ct
- 570 W Sutton Cir
- 1001 Keystone Ct
- 735 Silverberry Ct
- 1005 Keystone Ct
- 550 W Sutton Cir
- 740 Hermes Cir
- 520 W Sutton Cir
- 720 Hermes Cir
- 725 Silverberry Ct
- 760 Hermes Cir
- 1004 Sunburst Ct
- 595 E Sutton Cir