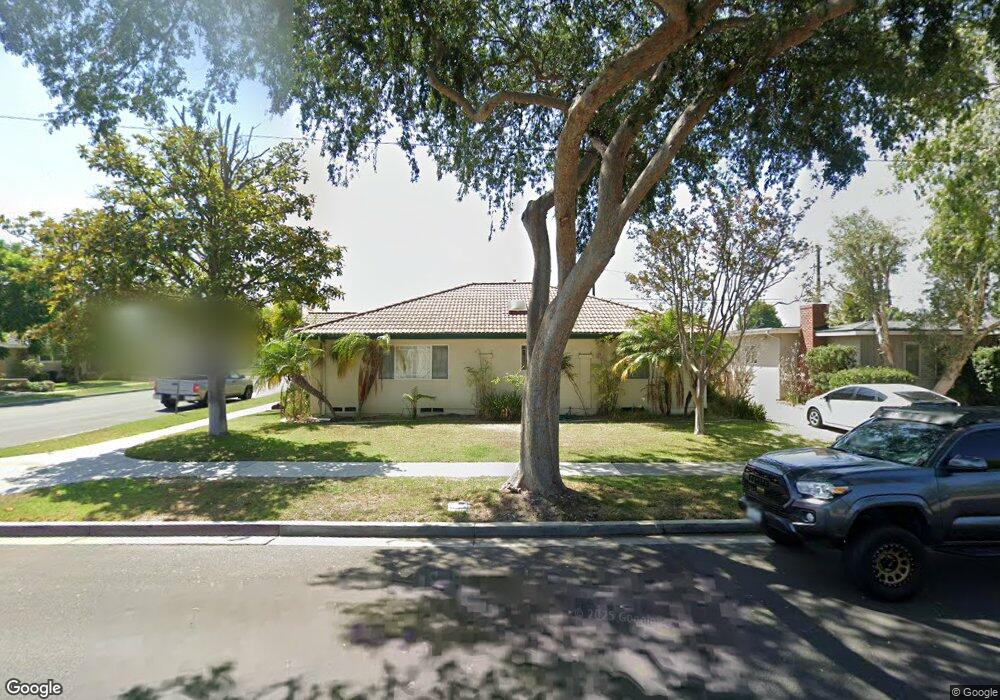
5930 E Los Arcos St Long Beach, CA 90815
Los Altos South NeighborhoodEstimated Value: $1,129,000 - $1,368,000
3
Beds
2
Baths
1,418
Sq Ft
$876/Sq Ft
Est. Value
About This Home
This home is located at 5930 E Los Arcos St, Long Beach, CA 90815 and is currently estimated at $1,242,606, approximately $876 per square foot. 5930 E Los Arcos St is a home located in Los Angeles County with nearby schools including Prisk Elementary School, Stanford Middle School, and Millikan High School.
Ownership History
Date
Name
Owned For
Owner Type
Purchase Details
Closed on
Oct 24, 2002
Sold by
Hall Theodore T and Hall Carol A
Bought by
Hall Theodore T
Current Estimated Value
Home Financials for this Owner
Home Financials are based on the most recent Mortgage that was taken out on this home.
Original Mortgage
$212,500
Outstanding Balance
$87,329
Interest Rate
5.89%
Estimated Equity
$1,155,277
Purchase Details
Closed on
Mar 22, 2001
Sold by
Klockers William Arthur and Estate Of Madeline I Robinson
Bought by
Hall Theodore T
Home Financials for this Owner
Home Financials are based on the most recent Mortgage that was taken out on this home.
Original Mortgage
$184,000
Interest Rate
6.89%
Purchase Details
Closed on
Jun 27, 1995
Sold by
Klockers William Arthur and Robinson Madeline I
Bought by
Klockers William Arthur
Home Financials for this Owner
Home Financials are based on the most recent Mortgage that was taken out on this home.
Original Mortgage
$64,000
Interest Rate
7.9%
Create a Home Valuation Report for This Property
The Home Valuation Report is an in-depth analysis detailing your home's value as well as a comparison with similar homes in the area
Home Values in the Area
Average Home Value in this Area
Purchase History
We collect this data history from publicly available records. To have your information removed, we recommend requesting removal directly through your county’s website.
| Date | Buyer | Sale Price | Title Company |
|---|---|---|---|
| Hall Theodore T | -- | New Century | |
| Hall Theodore T | -- | -- | |
| Hall Theodore T | $230,000 | Southland Title Corporation | |
| Klockers William Arthur | -- | Fidelity National Title Ins |
Source: Public Records
Mortgage History
We collect this data history from publicly available records. To have your information removed, we recommend requesting removal directly through your county’s website.
| Date | Status | Borrower | Loan Amount |
|---|---|---|---|
| Open | Hall Theodore T | $212,500 | |
| Previous Owner | Hall Theodore T | $184,000 | |
| Previous Owner | Klockers William Arthur | $64,000 | |
| Closed | Hall Theodore T | $23,000 |
Source: Public Records
Tax History
| Year | Tax Paid | Tax Assessment Tax Assessment Total Assessment is a certain percentage of the fair market value that is determined by local assessors to be the total taxable value of land and additions on the property. | Land | Improvement |
|---|---|---|---|---|
| 2025 | $6,931 | $533,095 | $349,577 | $183,518 |
| 2024 | $6,931 | $522,643 | $342,723 | $179,920 |
| 2023 | $6,816 | $512,396 | $336,003 | $176,393 |
| 2022 | $6,402 | $502,350 | $329,415 | $172,935 |
| 2021 | $6,268 | $492,501 | $322,956 | $169,545 |
| 2019 | $6,175 | $477,895 | $313,378 | $164,517 |
| 2018 | $5,929 | $468,526 | $307,234 | $161,292 |
| 2016 | $5,440 | $450,334 | $295,304 | $155,030 |
| 2015 | $5,222 | $443,571 | $290,869 | $152,702 |
| 2014 | $5,184 | $434,883 | $285,172 | $149,711 |
Source: Public Records
Map
Nearby Homes
- 6135 E 23rd St
- 2635 Gondar Ave
- 2430 Marber Ave
- 2660 Gondar Ave
- 2335 Carfax Ave
- 5640 E Deborah St
- 2726 Chatwin Ave
- 2400 Terraine Ave
- 2038 San Anseline Ave
- 5840 E Oakbrook St
- 1911 Snowden Ave
- 1875 Mcnab Ave
- 2178 Tulane Ave
- 1840 Lave Ave
- 2425 Heather Ave
- 5449 E Fairbrook St
- 1817 Lave Ave
- 1873 Marber Ave
- 1901 N Bellflower Blvd
- 2829 Iroquois Ave
- 5920 E Los Arcos St
- 5931 E Belice St
- 5921 E Belice St
- 5910 E Los Arcos St
- 2316 San Vicente Ave
- 2308 San Vicente Ave
- 5911 E Belice St
- 5900 E Los Arcos St
- 2300 San Vicente Ave
- 5940 E Los Arcos St
- 5901 E Belice St
- 5941 E 23rd St
- 5886 E Los Arcos St
- 2295 San Vicente Ave
- 5920 E Belice St
- 2296 San Vicente Ave
- 5950 E Los Arcos St
- 5910 E Belice St
- 5880 E Los Arcos St
- 5951 E 23rd St
Your Personal Tour Guide
Ask me questions while you tour the home.