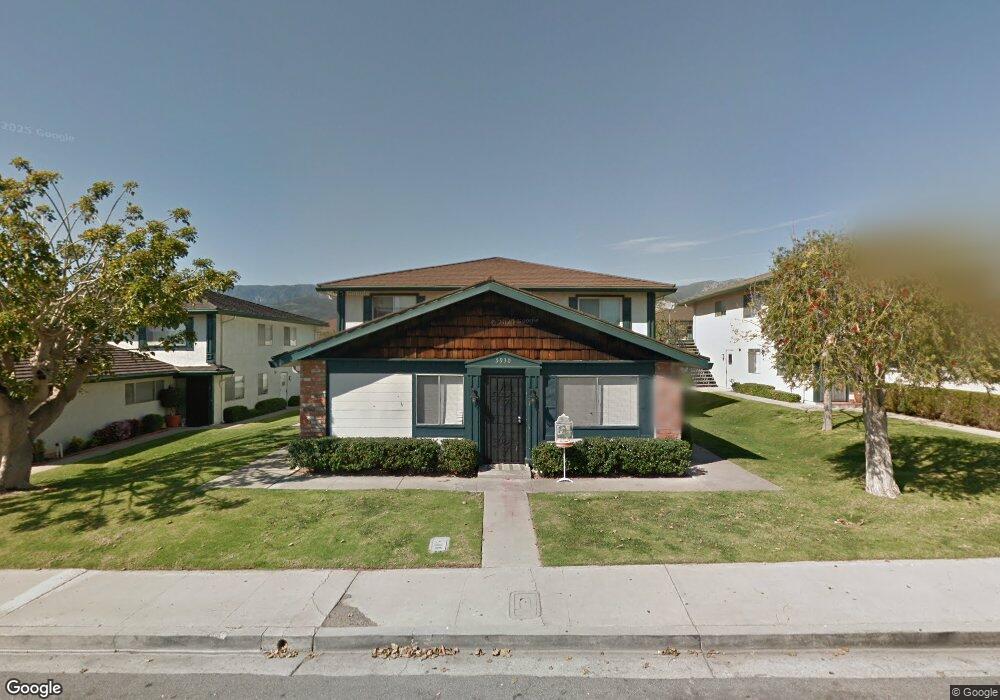
5930 Hickory St Unit 2 Carpinteria, CA 93013
Estimated Value: $650,204 - $682,000
2
Beds
1
Bath
840
Sq Ft
$796/Sq Ft
Est. Value
About This Home
This home is located at 5930 Hickory St Unit 2, Carpinteria, CA 93013 and is currently estimated at $668,551, approximately $795 per square foot. 5930 Hickory St Unit 2 is a home located in Santa Barbara County with nearby schools including Carpinteria Senior High School, The Howard School, and Cate School.
Create a Home Valuation Report for This Property
The Home Valuation Report is an in-depth analysis detailing your home's value as well as a comparison with similar homes in the area
Home Values in the Area
Average Home Value in this Area
Tax History
| Year | Tax Paid | Tax Assessment Tax Assessment Total Assessment is a certain percentage of the fair market value that is determined by local assessors to be the total taxable value of land and additions on the property. | Land | Improvement |
|---|---|---|---|---|
| 2025 | $3,706 | $271,550 | $110,380 | $161,170 |
| 2023 | $3,706 | $261,007 | $106,095 | $154,912 |
| 2022 | $3,562 | $255,890 | $104,015 | $151,875 |
| 2021 | $3,480 | $250,874 | $101,976 | $148,898 |
| 2020 | $3,425 | $248,303 | $100,931 | $147,372 |
| 2019 | $3,346 | $243,435 | $98,952 | $144,483 |
| 2018 | $3,279 | $238,662 | $97,012 | $141,650 |
| 2017 | $3,209 | $233,983 | $95,110 | $138,873 |
| 2016 | $3,154 | $229,396 | $93,246 | $136,150 |
| 2015 | $3,126 | $225,951 | $91,846 | $134,105 |
| 2014 | $2,955 | $221,526 | $90,047 | $131,479 |
Source: Public Records
Map
Nearby Homes
- 5945 Hickory St Unit 4
- 5930 Via Real Unit 3
- 5910 Via Real Unit 1
- 1025 Palmetto Way Unit I
- 6180 Via Real Unit 69
- 6180 Via Real Unit 29
- 6180 Via Real Unit 52
- 1197 Calle Lagunitas
- 5750 Via Real Unit 204
- 5700 Via Real Unit 106
- 5700 Via Real Unit 138
- 1214 Lomita Ln
- 5455 8th St Unit 58
- 5455 8th St Unit 95
- 5455 8th St Unit 5
- 5402 Cameo Rd
- 6660 Gobernador Canyon Rd
- 0 Gobernador Canyon Rd
- 855 Walnut Ave
- 876 Elm Ave
- 5930 Hickory St Unit 4
- 5930 Hickory St Unit 3
- 5930 Hickory St Unit 1
- 5926 Hickory Apt 1
- 5930 Hickory Ave Unit 4
- 5936 Hickory #2 Unit 2
- 5925 Hickory Apt 1 St
- 5926 Hickory Ave Unit 4
- 5926 Hickory # 1 St Unit 1
- 5926 Hickory St Unit 4
- 5926 Hickory St Unit 3
- 5926 Hickory St Unit 2
- 5926 Hickory St Unit 1
- 5936 Hickory St Unit 4
- 5936 Hickory St Unit 3
- 5936 Hickory St Unit 2
- 5936 Hickory St Unit 1
- 5926 Hickory 1weup77skjsk Unit 3
- 5936 Hickory Apt 3 St
- 5936 Hickory #4 St Unit 4
Your Personal Tour Guide
Ask me questions while you tour the home.