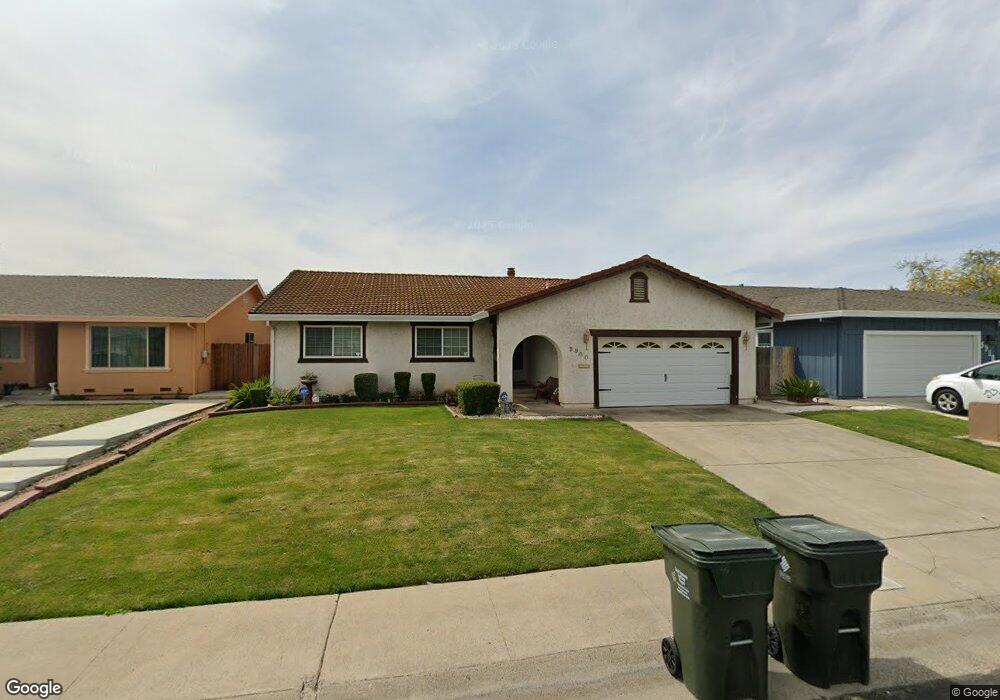
5930 La Castana Way Sacramento, CA 95823
North Laguna NeighborhoodEstimated Value: $366,000 - $654,685
3
Beds
2
Baths
1,609
Sq Ft
$312/Sq Ft
Est. Value
About This Home
This home is located at 5930 La Castana Way, Sacramento, CA 95823 and is currently estimated at $501,921, approximately $311 per square foot. 5930 La Castana Way is a home located in Sacramento County with nearby schools including John Reith Elementary School, Samuel Jackman Middle School, and Valley High School.
Ownership History
Date
Name
Owned For
Owner Type
Purchase Details
Closed on
Apr 25, 2021
Sold by
Garrett Rochella D and Garrett Rochella V
Bought by
Garrett Rochella D
Current Estimated Value
Home Financials for this Owner
Home Financials are based on the most recent Mortgage that was taken out on this home.
Original Mortgage
$162,875
Outstanding Balance
$147,605
Interest Rate
3.1%
Mortgage Type
New Conventional
Estimated Equity
$354,316
Purchase Details
Closed on
Apr 12, 1994
Sold by
Federal Home Loan Mortgage Corporation
Bought by
Garrett Rochella D
Home Financials for this Owner
Home Financials are based on the most recent Mortgage that was taken out on this home.
Original Mortgage
$101,845
Interest Rate
7.67%
Purchase Details
Closed on
Oct 15, 1993
Sold by
T D Service Company
Bought by
Nelson Eileen M
Create a Home Valuation Report for This Property
The Home Valuation Report is an in-depth analysis detailing your home's value as well as a comparison with similar homes in the area
Home Values in the Area
Average Home Value in this Area
Purchase History
| Date | Buyer | Sale Price | Title Company |
|---|---|---|---|
| Garrett Rochella D | -- | Servicelink | |
| Garrett Rochella D | $104,000 | Chicago Title Company | |
| Nelson Eileen M | $99,949 | -- |
Source: Public Records
Mortgage History
| Date | Status | Borrower | Loan Amount |
|---|---|---|---|
| Open | Garrett Rochella D | $162,875 | |
| Closed | Garrett Rochella D | $101,845 |
Source: Public Records
Tax History Compared to Growth
Tax History
| Year | Tax Paid | Tax Assessment Tax Assessment Total Assessment is a certain percentage of the fair market value that is determined by local assessors to be the total taxable value of land and additions on the property. | Land | Improvement |
|---|---|---|---|---|
| 2025 | $1,943 | $173,072 | $50,971 | $122,101 |
| 2024 | $1,943 | $169,679 | $49,972 | $119,707 |
| 2023 | $1,884 | $374,544 | $93,636 | $280,908 |
| 2022 | $4,012 | $367,200 | $91,800 | $275,400 |
| 2021 | $1,830 | $159,895 | $47,092 | $112,803 |
| 2020 | $1,799 | $158,257 | $46,610 | $111,647 |
| 2019 | $1,765 | $155,155 | $45,697 | $109,458 |
| 2018 | $1,714 | $152,113 | $44,801 | $107,312 |
| 2017 | $1,677 | $149,131 | $43,923 | $105,208 |
| 2016 | $1,600 | $146,208 | $43,062 | $103,146 |
| 2015 | $1,561 | $144,013 | $42,416 | $101,597 |
| 2014 | $1,543 | $141,193 | $41,586 | $99,607 |
Source: Public Records
Map
Nearby Homes
- 8272 Center Pkwy Unit 111
- 8138 La Almendra Way
- 8260 Center Pkwy Unit 92
- 8252 Center Pkwy
- 8252 Center Pkwy
- 8244 Center Pkwy Unit 65
- 8200 Center Pkwy Unit 9
- 8220 Center Pkwy Unit 38
- 8228 Center Pkwy Unit 46
- 6028 Hollyhurst Way
- 8216 Center Pkwy
- 8160 Valley Green Dr
- 6057 Hollyhurst Way
- 62 Hallowell Ct
- 44 Hallowell Ct
- 51 Hallowell Ct
- 45 Hallowell Ct
- 5300 Euler Way
- 39 Hallowell Ct
- 5296 La Pamela Way
- 5950 La Castana Way
- 5910 La Castana Way
- 5925 Ehrhardt Ave
- 5905 Ehrhardt Ave
- 5890 La Castana Way
- 5945 Ehrhardt Ave
- 5885 Ehrhardt Ave
- 5925 La Castana Way
- 5945 La Castana Way
- 5905 La Castana Way
- 5965 Ehrhardt Ave
- 5870 La Castana Way
- 5990 La Castana Way
- 5865 Ehrhardt Ave
- 5965 La Castana Way
- 5885 La Castana Way
- 5985 Ehrhardt Ave
- 5985 La Castana Way
- 5850 La Castana Way
- 6010 La Castana Way