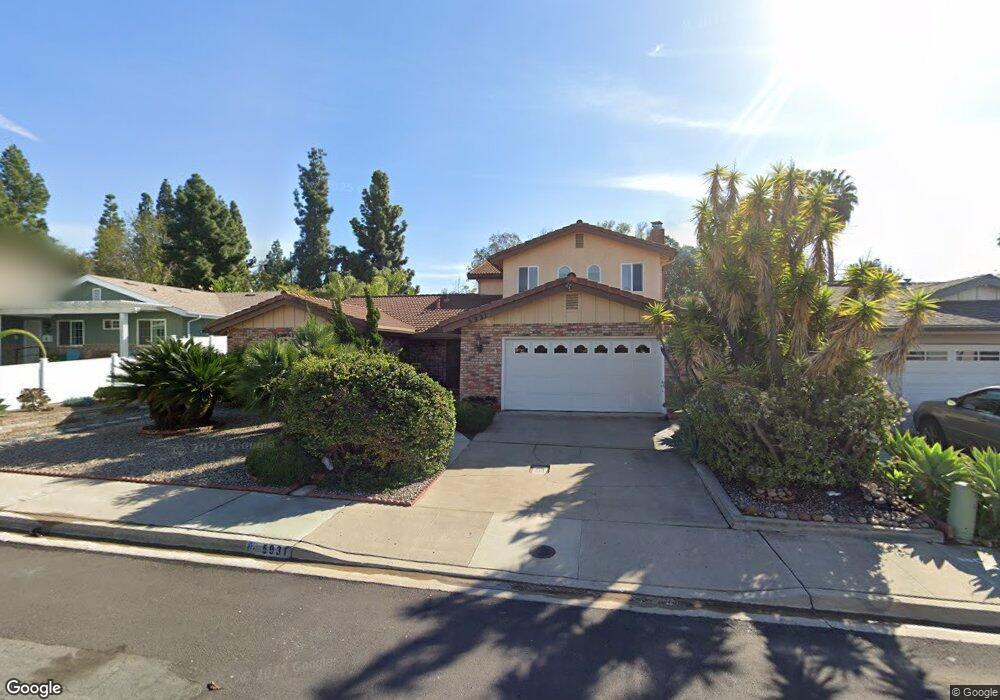
5931 Eldergardens St San Diego, CA 92120
Del Cerro NeighborhoodEstimated Value: $1,388,427 - $1,773,000
5
Beds
3
Baths
2,837
Sq Ft
$555/Sq Ft
Est. Value
About This Home
This home is located at 5931 Eldergardens St, San Diego, CA 92120 and is currently estimated at $1,575,857, approximately $555 per square foot. 5931 Eldergardens St is a home located in San Diego County with nearby schools including Hearst Elementary School, Lewis Middle School, and Patrick Henry High School.
Ownership History
Date
Name
Owned For
Owner Type
Purchase Details
Closed on
Feb 20, 2012
Sold by
Mcmahon Amalia
Bought by
Mcmahon Amalia
Current Estimated Value
Purchase Details
Closed on
Sep 15, 2005
Sold by
Mcmahon Amalia
Bought by
Mcmahon Amalia
Home Financials for this Owner
Home Financials are based on the most recent Mortgage that was taken out on this home.
Original Mortgage
$175,000
Outstanding Balance
$93,390
Interest Rate
5.81%
Mortgage Type
Fannie Mae Freddie Mac
Estimated Equity
$1,482,467
Purchase Details
Closed on
Jul 16, 2002
Sold by
Amalia Mcmahon Living Trust and Mcmahon Amalia
Bought by
Mcmahon Amalia and Amalia Mcmahon Trust
Purchase Details
Closed on
Feb 13, 1996
Sold by
Mcmahon Amalia
Bought by
Mcmahon Amalia
Purchase Details
Closed on
Dec 1, 1989
Purchase Details
Closed on
Jul 29, 1987
Create a Home Valuation Report for This Property
The Home Valuation Report is an in-depth analysis detailing your home's value as well as a comparison with similar homes in the area
Home Values in the Area
Average Home Value in this Area
Purchase History
| Date | Buyer | Sale Price | Title Company |
|---|---|---|---|
| Mcmahon Amalia | -- | None Available | |
| Mcmahon Amalia | -- | Fidelity National Title | |
| Mcmahon Amalia | -- | -- | |
| Mcmahon Amalia | -- | -- | |
| -- | $270,000 | -- | |
| -- | $190,000 | -- |
Source: Public Records
Mortgage History
| Date | Status | Borrower | Loan Amount |
|---|---|---|---|
| Open | Mcmahon Amalia | $175,000 |
Source: Public Records
Tax History Compared to Growth
Tax History
| Year | Tax Paid | Tax Assessment Tax Assessment Total Assessment is a certain percentage of the fair market value that is determined by local assessors to be the total taxable value of land and additions on the property. | Land | Improvement |
|---|---|---|---|---|
| 2025 | $5,535 | $463,978 | $129,427 | $334,551 |
| 2024 | $5,535 | $454,882 | $126,890 | $327,992 |
| 2023 | $5,411 | $445,963 | $124,402 | $321,561 |
| 2022 | $5,266 | $437,219 | $121,963 | $315,256 |
| 2021 | $5,228 | $428,647 | $119,572 | $309,075 |
| 2020 | $5,164 | $424,252 | $118,346 | $305,906 |
| 2019 | $5,071 | $415,934 | $116,026 | $299,908 |
| 2018 | $4,740 | $407,779 | $113,751 | $294,028 |
| 2017 | $4,626 | $399,784 | $111,521 | $288,263 |
| 2016 | $4,550 | $391,946 | $109,335 | $282,611 |
| 2015 | $4,482 | $386,059 | $107,693 | $278,366 |
| 2014 | $4,410 | $378,498 | $105,584 | $272,914 |
Source: Public Records
Map
Nearby Homes
- 6016 Wenrich Place
- 6329 Caminito Estrellado
- 6196 Rockhurst Dr
- 5996 College Ave
- 6183 Rockhurst Dr
- 5957 Caminito de la Taza
- 6221 Brynwood Ct
- 6342 Lambda Dr
- 6994 Carthage St
- 6642 Eldridge St
- 7232 Margerum Ave
- 6818 Carthage St
- 6817 Birchwood St
- 6347 Elmhurst Dr
- 6543 Carthage St
- 5701 Madra Ave
- 7414 Margerum Ave
- 7391 Margerum Ave
- 6464 Del Cerro Blvd
- 7310 Margerum Ave
- 5941 Eldergardens St
- 5915 Eldergardens St
- 5951 Eldergardens St
- 5922 Eldergardens St
- 5934 Eldergardens St
- 5910 Eldergardens St
- 5959 Eldergardens St
- 5946 Eldergardens St
- 5893 Eldergardens St
- 6252 Wenrich Dr
- 5958 Eldergardens St
- 5963 Eldergardens St
- 6244 Wenrich Dr
- 5875 Eldergardens St
- 5898 Eldergardens St
- 6275 Wenrich Dr
- 6252 Lance Place
- 6236 Wenrich Dr
- 6248 Chrismark Ave
- 6236 Lance Place