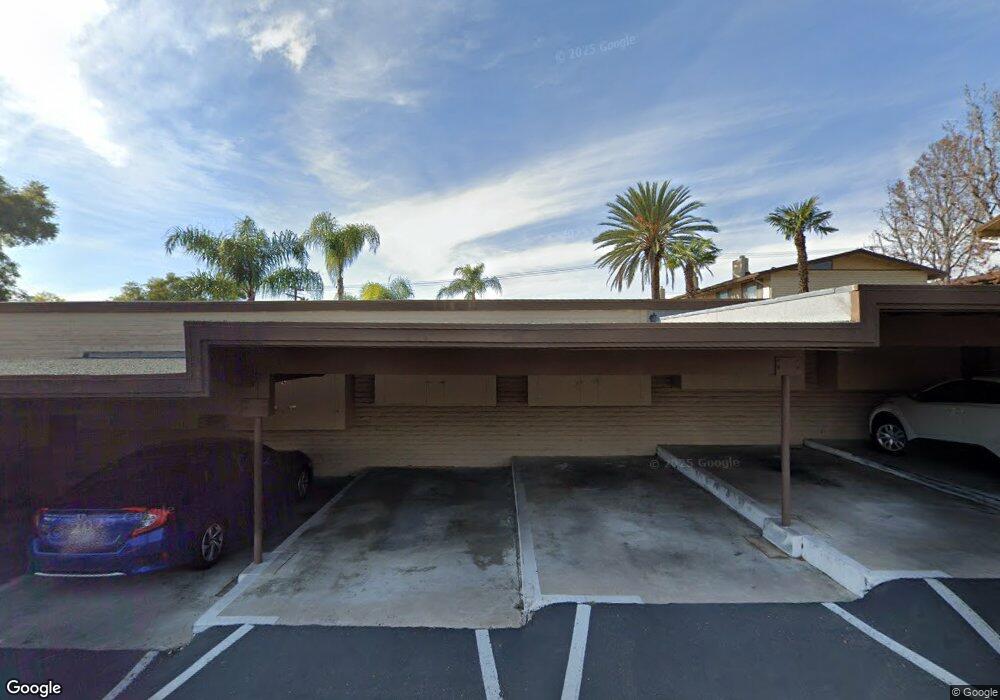
5931 Howell Dr Unit 11 La Mesa, CA 91942
Fletcher Hills NeighborhoodEstimated Value: $535,968 - $633,000
2
Beds
2
Baths
1,097
Sq Ft
$526/Sq Ft
Est. Value
About This Home
This home is located at 5931 Howell Dr Unit 11, La Mesa, CA 91942 and is currently estimated at $576,742, approximately $525 per square foot. 5931 Howell Dr Unit 11 is a home located in San Diego County with nearby schools including Northmont Elementary School, Parkway Academy, and Grossmont High School.
Ownership History
Date
Name
Owned For
Owner Type
Purchase Details
Closed on
Sep 14, 1998
Sold by
Va
Bought by
Centanni Robert F
Current Estimated Value
Purchase Details
Closed on
Oct 22, 1997
Sold by
Hodge David A
Bought by
Countrywide Home Loans Inc
Purchase Details
Closed on
Aug 11, 1997
Sold by
Countrywide Home Loans Inc
Bought by
Va
Purchase Details
Closed on
Apr 8, 1996
Sold by
Waise William D
Bought by
Hodge David A
Home Financials for this Owner
Home Financials are based on the most recent Mortgage that was taken out on this home.
Original Mortgage
$91,698
Interest Rate
7.82%
Mortgage Type
VA
Purchase Details
Closed on
Jun 29, 1990
Purchase Details
Closed on
Oct 1, 1986
Create a Home Valuation Report for This Property
The Home Valuation Report is an in-depth analysis detailing your home's value as well as a comparison with similar homes in the area
Home Values in the Area
Average Home Value in this Area
Purchase History
| Date | Buyer | Sale Price | Title Company |
|---|---|---|---|
| Centanni Robert F | $82,000 | First American Title | |
| Countrywide Home Loans Inc | $66,574 | Landsafe Title | |
| Va | -- | Landsafe Title | |
| Hodge David A | $90,000 | South Coast Title Company | |
| -- | $87,500 | -- | |
| -- | $68,000 | -- |
Source: Public Records
Mortgage History
| Date | Status | Borrower | Loan Amount |
|---|---|---|---|
| Previous Owner | Hodge David A | $91,698 | |
| Closed | Centanni Robert F | $0 |
Source: Public Records
Tax History Compared to Growth
Tax History
| Year | Tax Paid | Tax Assessment Tax Assessment Total Assessment is a certain percentage of the fair market value that is determined by local assessors to be the total taxable value of land and additions on the property. | Land | Improvement |
|---|---|---|---|---|
| 2025 | $3,560 | $309,927 | $144,824 | $165,103 |
| 2024 | $3,560 | $303,851 | $141,985 | $161,866 |
| 2023 | $3,457 | $297,894 | $139,201 | $158,693 |
| 2022 | $3,415 | $292,054 | $136,472 | $155,582 |
| 2021 | $3,372 | $286,329 | $133,797 | $152,532 |
| 2020 | $3,266 | $283,394 | $132,426 | $150,968 |
| 2019 | $3,218 | $277,838 | $129,830 | $148,008 |
| 2018 | $3,156 | $272,391 | $127,285 | $145,106 |
| 2017 | $3,111 | $267,051 | $124,790 | $142,261 |
| 2016 | $3,009 | $261,816 | $122,344 | $139,472 |
| 2015 | $2,894 | $250,000 | $115,000 | $135,000 |
| 2014 | $2,421 | $210,000 | $97,000 | $113,000 |
Source: Public Records
Map
Nearby Homes
- 5931 Howell Dr Unit 9
- 5931 Howell Dr Unit 14
- 5750 Amaya Dr Unit 10
- 5654 Amaya Dr Unit 150
- 9360 Monona Dr
- 5995 Broadmoor Dr
- 6130 Howell Dr
- 9431 Hilmer Dr
- 9348 Horton Dr
- 9310 Wister Dr
- 0 Grossmont Unit PTP2505998
- 0 El Granito Ave Unit PTP2407205
- 8767 Blue Lake Dr
- 282 Garfield Ave
- 6056 Winfield Ave
- 9608 Sunset Ave
- 275 Hihill Way
- 198 Croydon Ln
- 1894 Wedgemere Rd
- 2394 Dryden Rd
- 5931 Howell Dr
- 5931 Howell Dr Unit 27
- 5931 Howell Dr Unit 8
- 5931 Howell Dr Unit 16
- 5931 Howell Dr Unit 15
- 5931 Howell Dr Unit 13
- 5931 Howell Dr Unit 12
- 5931 Howell Dr Unit 10
- 5931 Howell Dr Unit 7
- 5931 Howell Dr Unit 6
- 5931 Howell Dr Unit 5
- 5931 Howell Dr Unit 4
- 5931 Howell Dr Unit 3
- 5931 Howell Dr Unit 2
- 5931 Howell Dr Unit 1
- 5931 Howell Dr Unit 30
- 5931 Howell Dr Unit 29
- 5931 Howell Dr Unit 28
- 5931 Howell Dr Unit 26
- 5931 Howell Dr Unit 25