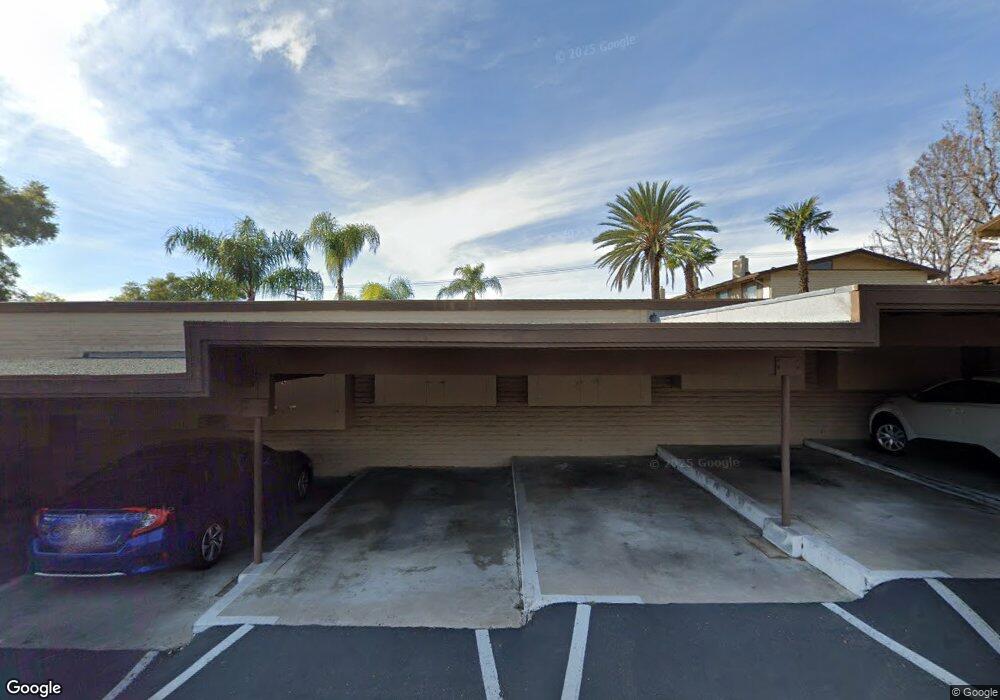
5931 Howell Dr Unit 27 La Mesa, CA 91942
Fletcher Hills NeighborhoodEstimated Value: $491,000 - $532,438
2
Beds
2
Baths
1,097
Sq Ft
$463/Sq Ft
Est. Value
About This Home
This home is located at 5931 Howell Dr Unit 27, La Mesa, CA 91942 and is currently estimated at $507,860, approximately $462 per square foot. 5931 Howell Dr Unit 27 is a home located in San Diego County with nearby schools including Northmont Elementary School, Parkway Academy, and Grossmont High School.
Ownership History
Date
Name
Owned For
Owner Type
Purchase Details
Closed on
Jan 12, 2023
Sold by
Mary A Asberry Living Trust
Bought by
Herron Rockwell E
Current Estimated Value
Home Financials for this Owner
Home Financials are based on the most recent Mortgage that was taken out on this home.
Original Mortgage
$337,500
Outstanding Balance
$326,539
Interest Rate
6.33%
Mortgage Type
New Conventional
Estimated Equity
$181,321
Purchase Details
Closed on
Mar 28, 2007
Sold by
Asberry Mary
Bought by
Asberry Mary A
Purchase Details
Closed on
Sep 28, 2000
Sold by
Havorka Lori S
Bought by
Asberry Mary
Purchase Details
Closed on
May 24, 2000
Sold by
Hatfield Creek Egg Ranch Inc
Bought by
Harman Robert J and Harman Susan P
Purchase Details
Closed on
May 23, 1986
Create a Home Valuation Report for This Property
The Home Valuation Report is an in-depth analysis detailing your home's value as well as a comparison with similar homes in the area
Home Values in the Area
Average Home Value in this Area
Purchase History
| Date | Buyer | Sale Price | Title Company |
|---|---|---|---|
| Herron Rockwell E | $450,000 | Wfg National Title | |
| Asberry Mary A | -- | None Available | |
| Asberry Mary | $134,000 | Chicago Title Co | |
| Harman Robert J | $1,200,000 | California Title Co | |
| -- | $62,000 | -- |
Source: Public Records
Mortgage History
| Date | Status | Borrower | Loan Amount |
|---|---|---|---|
| Open | Herron Rockwell E | $337,500 |
Source: Public Records
Tax History
| Year | Tax Paid | Tax Assessment Tax Assessment Total Assessment is a certain percentage of the fair market value that is determined by local assessors to be the total taxable value of land and additions on the property. | Land | Improvement |
|---|---|---|---|---|
| 2025 | $5,487 | $468,178 | $122,268 | $345,910 |
| 2024 | $5,487 | $458,999 | $119,871 | $339,128 |
| 2023 | $2,234 | $194,052 | $50,678 | $143,374 |
| 2022 | $2,206 | $190,248 | $49,685 | $140,563 |
| 2021 | $2,178 | $186,518 | $48,711 | $137,807 |
| 2020 | $2,110 | $184,606 | $48,212 | $136,394 |
| 2019 | $2,078 | $180,987 | $47,267 | $133,720 |
| 2018 | $2,037 | $177,440 | $46,341 | $131,099 |
| 2017 | $50 | $173,962 | $45,433 | $128,529 |
| 2016 | $1,941 | $170,552 | $44,543 | $126,009 |
| 2015 | $1,926 | $167,991 | $43,874 | $124,117 |
| 2014 | $1,887 | $164,701 | $43,015 | $121,686 |
Source: Public Records
Map
Nearby Homes
- 5931 Howell Dr
- 5931 Howell Dr Unit 7
- 5815 Amaya Dr
- 5642 Amaya Dr Unit 98
- 6050 Henderson Dr Unit 9
- 9345 Monona Dr
- 6130 Howell Dr
- 9110 Brier Rd
- 6141-43 Horton Dr
- 9218 Briercrest Dr
- 6110 Amaya Dr
- 5941 Lubbock Ave
- 0 Grossmont Unit PTP2505998
- 2679 Ferdinand Rd
- 157 Thrasher Way
- 9608 Sunset Ave
- 6070 Odessa Ave
- 1894 Wedgemere Rd
- 9272 Mesa Vista Ave
- 9542 Ridgecrest Dr
- 5931 Howell Dr Unit 8
- 5931 Howell Dr Unit 16
- 5931 Howell Dr Unit 15
- 5931 Howell Dr Unit 13
- 5931 Howell Dr Unit 12
- 5931 Howell Dr Unit 11
- 5931 Howell Dr Unit 10
- 5931 Howell Dr Unit 6
- 5931 Howell Dr Unit 5
- 5931 Howell Dr Unit 4
- 5931 Howell Dr Unit 3
- 5931 Howell Dr Unit 2
- 5931 Howell Dr Unit 1
- 5931 Howell Dr Unit 30
- 5931 Howell Dr Unit 29
- 5931 Howell Dr Unit 28
- 5931 Howell Dr Unit 26
- 5931 Howell Dr Unit 25
- 5931 Howell Dr Unit 24
- 5931 Howell Dr Unit 23
Your Personal Tour Guide
Ask me questions while you tour the home.