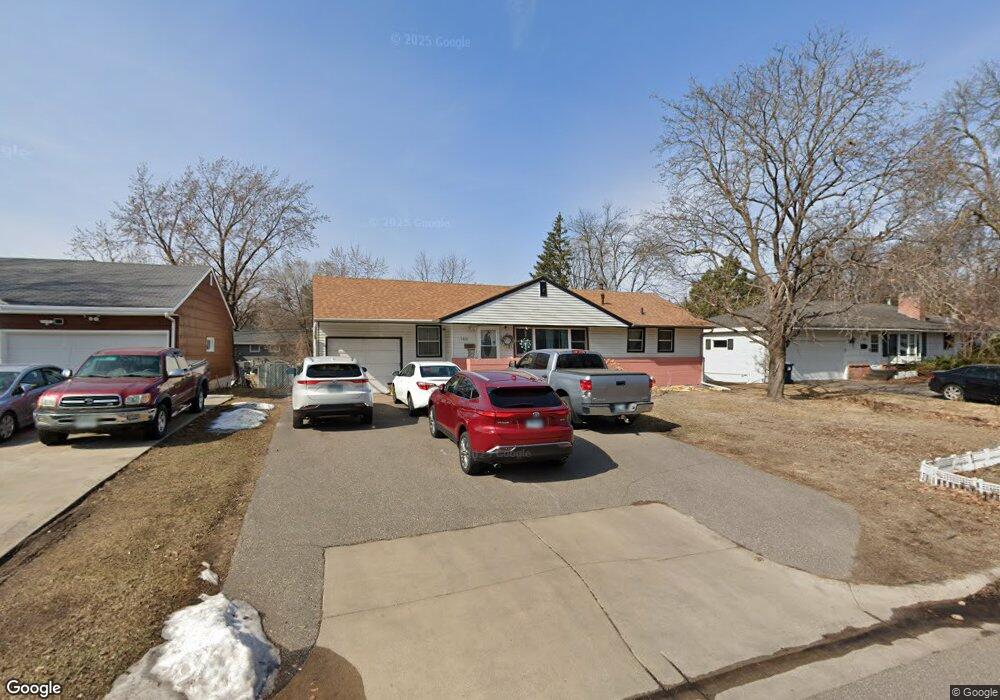
5931 Pearson Dr Minneapolis, MN 55429
Kylawn NeighborhoodEstimated Value: $305,323 - $353,000
3
Beds
2
Baths
1,132
Sq Ft
$285/Sq Ft
Est. Value
About This Home
This home is located at 5931 Pearson Dr, Minneapolis, MN 55429 and is currently estimated at $322,831, approximately $285 per square foot. 5931 Pearson Dr is a home located in Hennepin County with nearby schools including Northport Elementary School, Robbinsdale Middle School, and Robbinsdale Cooper Senior High School.
Ownership History
Date
Name
Owned For
Owner Type
Purchase Details
Closed on
Feb 20, 2018
Sold by
Xiong Mike
Bought by
Xiong Mike and Xiong Chaying
Current Estimated Value
Purchase Details
Closed on
Mar 17, 2016
Sold by
The Secretary Of Housing & Urban Develop
Bought by
Xiong Mike
Purchase Details
Closed on
Oct 23, 2015
Sold by
Bank Of America Na
Bought by
The Secretary Of Housing & Urban Develop
Purchase Details
Closed on
Aug 6, 2012
Sold by
Vasquez Alondra
Bought by
Bank Of America Na
Purchase Details
Closed on
Jan 26, 2010
Sold by
Alvarado Antonio and Alvarado Patricia
Bought by
Vasquez Alondra
Purchase Details
Closed on
May 18, 2005
Sold by
Frey Lucille M
Bought by
Cisneros Alvarado Antonio and Cisneros Alvarado Patricia
Purchase Details
Closed on
Jan 4, 1999
Sold by
Varness Brian K and Varness Michelle
Bought by
Frey Vernon J and Frey Lucille M
Create a Home Valuation Report for This Property
The Home Valuation Report is an in-depth analysis detailing your home's value as well as a comparison with similar homes in the area
Home Values in the Area
Average Home Value in this Area
Purchase History
| Date | Buyer | Sale Price | Title Company |
|---|---|---|---|
| Xiong Mike | -- | Ancona Title & Escrow | |
| Xiong Mike | -- | Ancona Title & Escrow | |
| The Secretary Of Housing & Urban Develop | -- | Attorney | |
| Bank Of America Na | $155,055 | -- | |
| Bank Of America Na | $155,055 | None Available | |
| Vasquez Alondra | $150,000 | -- | |
| Cisneros Alvarado Antonio | $204,100 | -- | |
| Frey Vernon J | $104,000 | -- |
Source: Public Records
Tax History
| Year | Tax Paid | Tax Assessment Tax Assessment Total Assessment is a certain percentage of the fair market value that is determined by local assessors to be the total taxable value of land and additions on the property. | Land | Improvement |
|---|---|---|---|---|
| 2024 | $4,043 | $281,700 | $99,000 | $182,700 |
| 2023 | $3,516 | $252,700 | $71,000 | $181,700 |
| 2022 | $3,747 | $261,000 | $84,000 | $177,000 |
| 2021 | $3,847 | $225,000 | $70,000 | $155,000 |
| 2020 | $3,846 | $216,000 | $69,000 | $147,000 |
| 2019 | $3,675 | $209,000 | $69,000 | $140,000 |
| 2018 | $3,337 | $187,000 | $60,000 | $127,000 |
| 2017 | $3,054 | $150,000 | $46,000 | $104,000 |
| 2016 | $3,449 | $143,100 | $44,500 | $98,600 |
| 2015 | $3,265 | $132,700 | $39,500 | $93,200 |
| 2014 | -- | $115,200 | $34,400 | $80,800 |
Source: Public Records
Map
Nearby Homes
- 5808 Pearson Dr
- 6012 Beard Ave N
- 5530 Halifax Ave N
- 4710 58th Ave N Unit 303
- 4710 58th Ave N Unit 221
- 4710 58th Ave N Unit 202
- 4710 58th Ave N Unit 219
- 4710 58th Ave N Unit 201
- 4710 58th Ave N Unit 208
- 4710 58th Ave N Unit 319
- 4710 58th Ave N Unit 106
- 6019 Zenith Ave N
- 5942 Zenith Ave N
- 6236 Major Ave N
- 6318 Kyle Ave N
- 5757 Orchard Ave N
- 5741 Perry Ave N
- 5325 Twin Lake Blvd E
- 5337 Sailor Ln
- 6318 Perry Ave N
- 5925 Pearson Dr
- 6001 Pearson Dr
- 5936 Halifax Place
- 5919 Pearson Dr
- 6007 Pearson Dr
- 5930 Halifax Place
- 6000 Halifax Place
- 5924 Pearson Dr
- 5924 Halifax Place
- 5930 Pearson Dr
- 6006 Halifax Place
- 5913 Pearson Dr
- 5918 Pearson Dr
- 6013 Pearson Dr
- 6000 Pearson Dr
- 5918 Halifax Place
- 6012 Halifax Place
- 5912 Pearson Dr
- 6006 Pearson Dr
- 5907 Pearson Dr
Your Personal Tour Guide
Ask me questions while you tour the home.