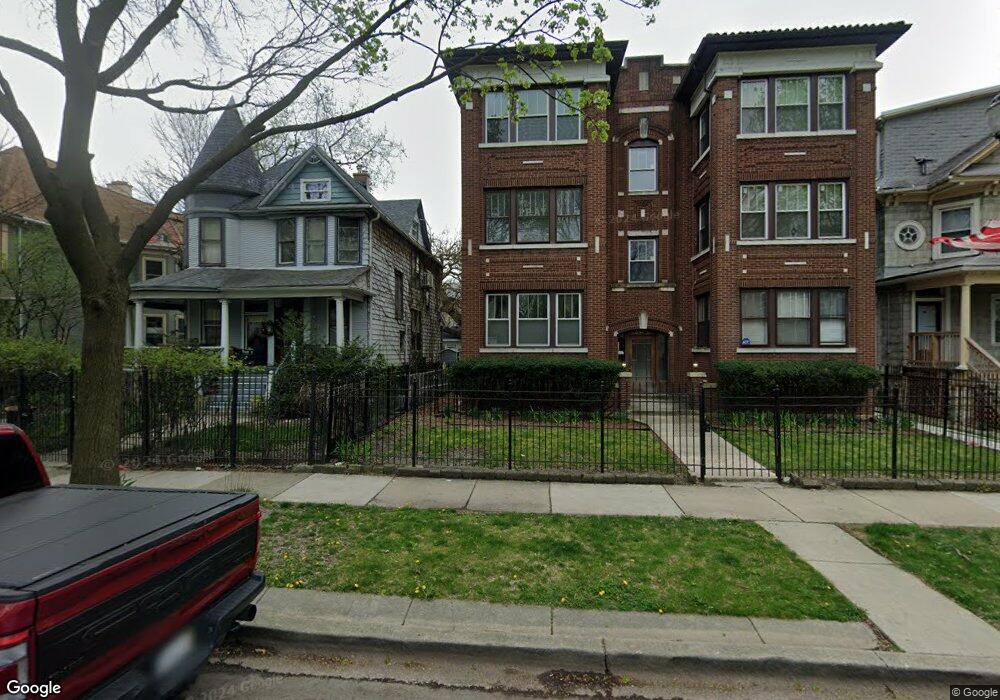
5931 W Midway Park Unit 1W Chicago, IL 60644
Austin NeighborhoodEstimated Value: $146,154 - $192,000
--
Bed
--
Bath
13,240
Sq Ft
$13/Sq Ft
Est. Value
About This Home
This home is located at 5931 W Midway Park Unit 1W, Chicago, IL 60644 and is currently estimated at $166,289, approximately $12 per square foot. 5931 W Midway Park Unit 1W is a home located in Cook County with nearby schools including Ellington Elementary School, St. Catherine - St. Lucy School, and The Field School.
Ownership History
Date
Name
Owned For
Owner Type
Purchase Details
Closed on
Oct 9, 2000
Sold by
Firstar Bank Na
Bought by
Ross Terrence T
Current Estimated Value
Home Financials for this Owner
Home Financials are based on the most recent Mortgage that was taken out on this home.
Original Mortgage
$113,000
Interest Rate
7.96%
Create a Home Valuation Report for This Property
The Home Valuation Report is an in-depth analysis detailing your home's value as well as a comparison with similar homes in the area
Home Values in the Area
Average Home Value in this Area
Purchase History
| Date | Buyer | Sale Price | Title Company |
|---|---|---|---|
| Ross Terrence T | $113,000 | -- |
Source: Public Records
Mortgage History
| Date | Status | Borrower | Loan Amount |
|---|---|---|---|
| Closed | Ross Terrence T | $113,000 |
Source: Public Records
Tax History Compared to Growth
Tax History
| Year | Tax Paid | Tax Assessment Tax Assessment Total Assessment is a certain percentage of the fair market value that is determined by local assessors to be the total taxable value of land and additions on the property. | Land | Improvement |
|---|---|---|---|---|
| 2024 | $1,177 | $19,696 | $1,230 | $18,466 |
| 2023 | $1,126 | $8,897 | $871 | $8,026 |
| 2022 | $1,126 | $8,897 | $871 | $8,026 |
| 2021 | $1,119 | $8,896 | $870 | $8,026 |
| 2020 | $977 | $7,488 | $870 | $6,618 |
| 2019 | $983 | $8,323 | $870 | $7,453 |
| 2018 | $965 | $8,323 | $870 | $7,453 |
| 2017 | $662 | $6,449 | $768 | $5,681 |
| 2016 | $792 | $6,449 | $768 | $5,681 |
| 2015 | $701 | $6,449 | $768 | $5,681 |
| 2014 | $1,596 | $11,168 | $794 | $10,374 |
| 2013 | $1,553 | $11,168 | $794 | $10,374 |
Source: Public Records
Map
Nearby Homes
- 5927 W Erie St
- 316 N Austin Blvd
- 5901 W Erie St
- 126 N Taylor Ave Unit 1S
- 5815 W Fulton St
- 5939 W Huron St
- 5731 W Ohio St
- 143 N Taylor Ave
- 216 N Mayfield Ave
- 136 S Taylor Ave
- 227-229 N Menard Ave
- 403 N Humphrey Ave
- 129 N Mason Ave Unit 105
- 118 N Mayfield Ave
- 5616 W Ohio St
- 128 N Menard Ave
- 556 N Central Ave
- 255 South Blvd Unit 7
- 824 N Austin Blvd Unit 3E
- 62 Chicago Ave
- 5931 W Midway Park Unit 1E
- 5933 W Midway Park Unit 3W
- 5931 W Midway Park Unit 3E
- 5931 W Midway Park Unit 2E
- 5933 W Midway Park Unit 2W
- 5929 W Midway Park
- 5929 W Midway Park
- 5937 W Midway Park Unit 39
- 5925 W Midway Park
- 5945 W Midway Park
- 5919 W Midway Park Unit 3E
- 5919 W Midway Park Unit 1W
- 5919 W Midway Park Unit 2W
- 5919 W Midway Park Unit 3W
- 5917 W Midway Park Unit 2
- 5917 W Midway Park
- 5951 W Midway Park
- 5938 W Lake St
- 5946 W Lake St
- 5916 W Lake St