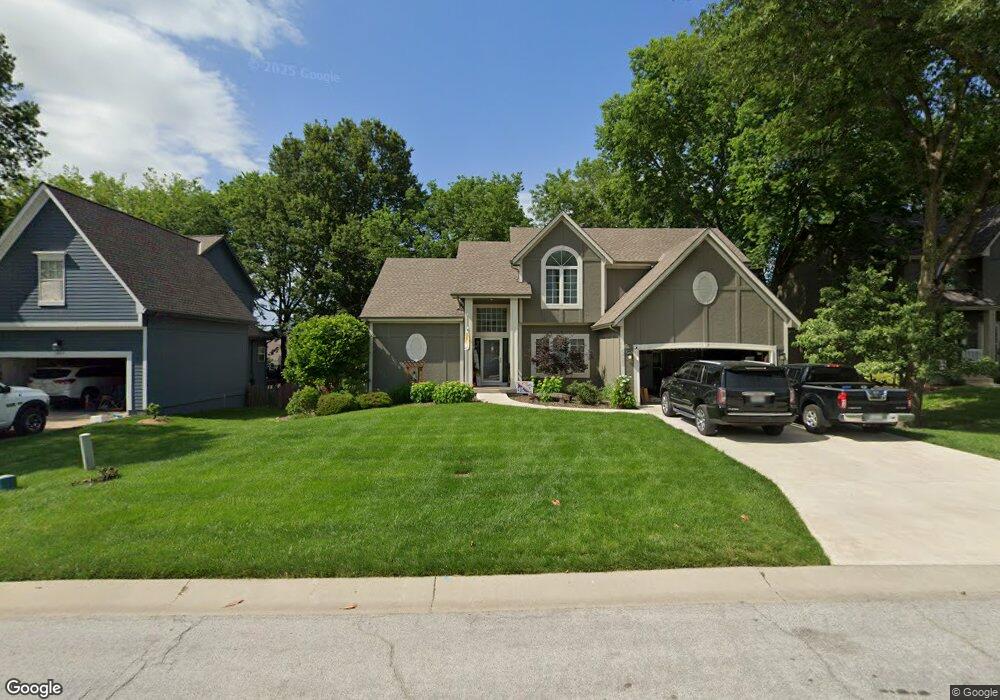
5933 NE Ruby Ln Lees Summit, MO 64064
Chapel Ridge NeighborhoodEstimated Value: $413,533 - $473,000
3
Beds
3
Baths
2,030
Sq Ft
$218/Sq Ft
Est. Value
About This Home
This home is located at 5933 NE Ruby Ln, Lees Summit, MO 64064 and is currently estimated at $443,133, approximately $218 per square foot. 5933 NE Ruby Ln is a home located in Jackson County with nearby schools including Voy Spears Jr. Elementary School, Delta Woods Middle School, and Blue Springs South High School.
Ownership History
Date
Name
Owned For
Owner Type
Purchase Details
Closed on
Jun 22, 2021
Sold by
Stevens James and Stevens Jennifer
Bought by
Stevens James and Stevens Jennifer
Current Estimated Value
Purchase Details
Closed on
Apr 26, 2017
Sold by
Graybill Jimmy R and Graybill Sandra
Bought by
Stevens James and Stevens Jennifer
Home Financials for this Owner
Home Financials are based on the most recent Mortgage that was taken out on this home.
Original Mortgage
$204,000
Outstanding Balance
$168,162
Interest Rate
4.3%
Mortgage Type
New Conventional
Estimated Equity
$274,971
Purchase Details
Closed on
Nov 12, 1997
Sold by
Thomson & Sailors Homes
Bought by
Graybill Jimmy R and Graybill Sandra
Home Financials for this Owner
Home Financials are based on the most recent Mortgage that was taken out on this home.
Original Mortgage
$167,200
Interest Rate
5.25%
Mortgage Type
Purchase Money Mortgage
Create a Home Valuation Report for This Property
The Home Valuation Report is an in-depth analysis detailing your home's value as well as a comparison with similar homes in the area
Home Values in the Area
Average Home Value in this Area
Purchase History
| Date | Buyer | Sale Price | Title Company |
|---|---|---|---|
| Stevens James | -- | None Available | |
| Stevens James | $255,000 | Chicago Title | |
| Graybill Jimmy R | -- | -- |
Source: Public Records
Mortgage History
| Date | Status | Borrower | Loan Amount |
|---|---|---|---|
| Open | Stevens James | $204,000 | |
| Previous Owner | Graybill Jimmy R | $167,200 |
Source: Public Records
Tax History
| Year | Tax Paid | Tax Assessment Tax Assessment Total Assessment is a certain percentage of the fair market value that is determined by local assessors to be the total taxable value of land and additions on the property. | Land | Improvement |
|---|---|---|---|---|
| 2025 | $5,500 | $67,089 | $14,423 | $52,666 |
| 2024 | $5,401 | $71,820 | $9,354 | $62,466 |
| 2023 | $5,401 | $71,820 | $10,351 | $61,469 |
| 2022 | $4,308 | $50,730 | $9,063 | $41,667 |
| 2021 | $4,304 | $50,730 | $9,063 | $41,667 |
| 2020 | $3,958 | $46,137 | $9,063 | $37,074 |
| 2019 | $3,836 | $46,137 | $9,063 | $37,074 |
| 2018 | $3,874 | $45,193 | $6,609 | $38,584 |
| 2017 | $3,874 | $45,193 | $6,609 | $38,584 |
| 2016 | $3,765 | $44,061 | $7,372 | $36,689 |
| 2014 | $3,841 | $44,672 | $6,406 | $38,266 |
Source: Public Records
Map
Nearby Homes
- 5920 NE Ruby Ln
- 5805 NE Ruby Ct
- 6020 NE Moonstone Dr
- 5821 NE Coral Dr
- 6033 NE Moonstone Dr
- 304 NE Hidden Valley Way
- 225 NE Misty Meadow Dr
- 6125 NE Moonstone Ct
- 6011 NE Kensington Ct
- 332 NE Parks Edge Dr
- 6115 NE Kensington Dr
- 5801 NE Hidden Meadow Cir
- 6160 NE Kensington Dr
- 1008 NE Moss Point Rd
- 6122 NE Upper Wood Rd
- 5509 NE Wildflower Ct
- 6201 NE Upper Wood Rd
- 5707 NW Sunrise Meadow Cir
- 1005 NE Scenic Ct
- 5581 NW Sunrise Meadow Ln
- 5929 NE Ruby Ln
- 5937 NE Ruby Ln
- 5941 NE Ruby Ln
- 5916 NE Ruby Ln
- 5925 NE Ruby Ln
- 5912 NE Ruby Ln
- 5924 NE Ruby Ln
- 5921 NE Ruby Ln
- 5945 NE Ruby Ln
- 513 NE Garnet Ln
- 517 NE Garnet Ln
- 509 NE Garnet Ln
- 5908 NE Ruby Ln
- 521 NE Garnet Ln
- 505 NE Garnet Ln
- 5928 NE Ruby Ln
- 525 NE Garnet Ln
- 5949 NE Ruby Ln
- 5917 NE Ruby Ln
- 512 NE Emerald Dr
Your Personal Tour Guide
Ask me questions while you tour the home.