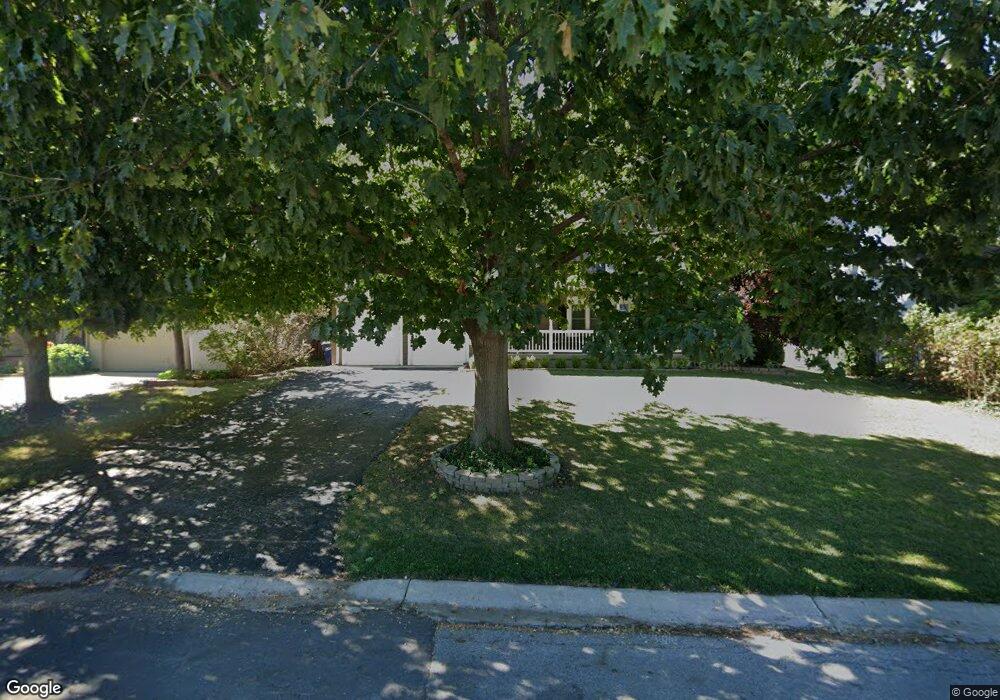
5935 W 61st St Mission, KS 66202
Estimated Value: $481,000 - $555,000
4
Beds
3
Baths
2,095
Sq Ft
$250/Sq Ft
Est. Value
About This Home
This home is located at 5935 W 61st St, Mission, KS 66202 and is currently estimated at $524,229, approximately $250 per square foot. 5935 W 61st St is a home located in Johnson County with nearby schools including Rushton Elementary School, Hocker Grove Middle School, and Shawnee Mission North High School.
Ownership History
Date
Name
Owned For
Owner Type
Purchase Details
Closed on
Apr 15, 2014
Sold by
Gregory Bradley J and Gregory Britton H
Bought by
Gregory Bradley J and Gregory Britton H
Current Estimated Value
Home Financials for this Owner
Home Financials are based on the most recent Mortgage that was taken out on this home.
Original Mortgage
$160,000
Outstanding Balance
$46,115
Interest Rate
3.48%
Mortgage Type
New Conventional
Estimated Equity
$478,114
Purchase Details
Closed on
Jul 19, 2005
Sold by
Gregory Bradley J and Gregory Britton H
Bought by
Gregory Britton H
Purchase Details
Closed on
Apr 8, 2002
Sold by
Simmons Mickey K and Simmons Kathleen E
Bought by
Gregory Bradley J and Gregory Britton H
Home Financials for this Owner
Home Financials are based on the most recent Mortgage that was taken out on this home.
Original Mortgage
$162,800
Interest Rate
6.8%
Create a Home Valuation Report for This Property
The Home Valuation Report is an in-depth analysis detailing your home's value as well as a comparison with similar homes in the area
Home Values in the Area
Average Home Value in this Area
Purchase History
| Date | Buyer | Sale Price | Title Company |
|---|---|---|---|
| Gregory Bradley J | -- | Professional Title Llc | |
| Gregory Britton H | -- | None Available | |
| Gregory Bradley J | -- | Security Land Title Company |
Source: Public Records
Mortgage History
| Date | Status | Borrower | Loan Amount |
|---|---|---|---|
| Open | Gregory Bradley J | $160,000 | |
| Closed | Gregory Bradley J | $162,800 |
Source: Public Records
Tax History Compared to Growth
Tax History
| Year | Tax Paid | Tax Assessment Tax Assessment Total Assessment is a certain percentage of the fair market value that is determined by local assessors to be the total taxable value of land and additions on the property. | Land | Improvement |
|---|---|---|---|---|
| 2024 | $6,885 | $57,466 | $11,115 | $46,351 |
| 2023 | $6,672 | $55,062 | $10,105 | $44,957 |
| 2022 | $6,045 | $50,542 | $8,794 | $41,748 |
| 2021 | $6,045 | $46,138 | $7,987 | $38,151 |
| 2020 | $5,570 | $43,528 | $6,945 | $36,583 |
| 2019 | $5,173 | $40,008 | $4,624 | $35,384 |
| 2018 | $4,367 | $37,041 | $4,624 | $32,417 |
| 2017 | $4,234 | $31,268 | $4,624 | $26,644 |
| 2016 | $4,100 | $29,819 | $4,624 | $25,195 |
| 2015 | $3,867 | $28,071 | $4,624 | $23,447 |
| 2013 | -- | $22,770 | $4,624 | $18,146 |
Source: Public Records
Map
Nearby Homes
- 6219 W 61st Terrace
- 6108 W 62nd Terrace
- 5612 W 61st Terrace
- 6407 W 62nd St
- 6301 Woodson Dr
- 6130 Riggs Rd
- 5940 Nall Ave
- 6025 Nall Ave
- 5729 Dearborn St
- 6219 W 65th St
- 6241 Rosewood Ct
- 6247 Rosewood St
- 5701 Russell St
- 5400 W 58th St
- 6500 Nall Ave
- 5312 W 58th St
- 4976 W 60th Terrace
- 5111 W 64th St
- 6800 W 66th St
- 6620 W 56th St
- 6001 W 61st St
- 5921 W 61st St
- 6007 W 61st St
- 5905 W 61st St
- 5916 W 61st Terrace
- 5924 W 61st Terrace
- 6013 W 61st St
- 6000 W 61st Terrace
- 5910 W 61st Terrace
- 5902 W 61st Terrace
- 6019 W 61st St
- 6008 W 61st Terrace
- 6020 W 61st Terrace
- 5820 W 61st Terrace
- 6101 W 61st St
- 6037 Woodson Rd
- 5917 W 61st Terrace
- 6001 W 61st Terrace
- 5911 W 61st Terrace
- 6100 W 61st Terrace