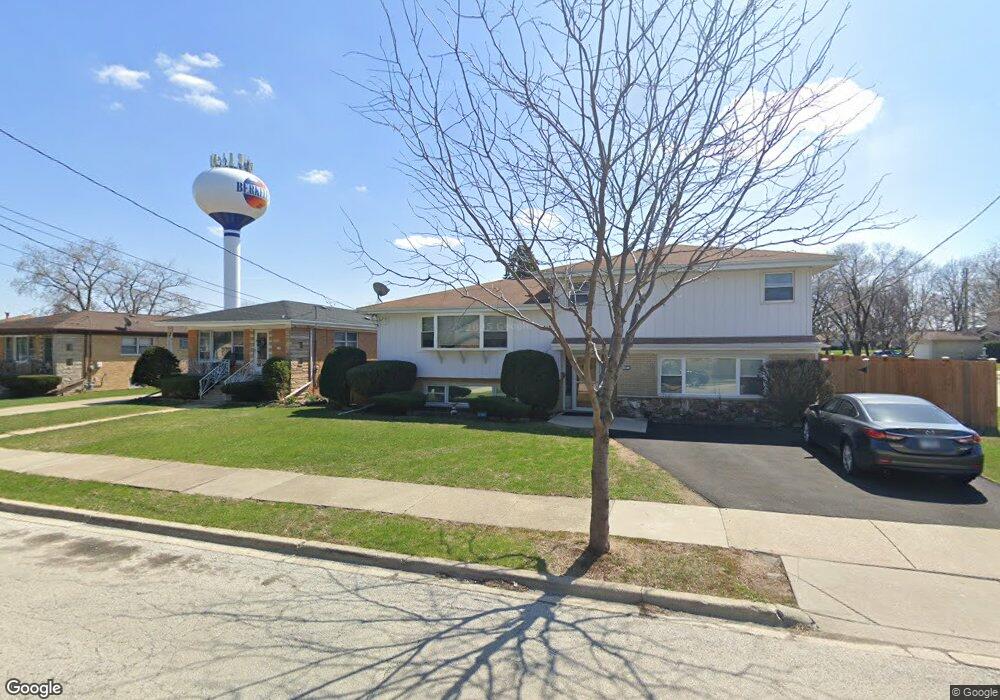
5935 W Maple Ave Berkeley, IL 60163
Estimated Value: $337,925 - $391,000
3
Beds
3
Baths
1,850
Sq Ft
$198/Sq Ft
Est. Value
About This Home
This home is located at 5935 W Maple Ave, Berkeley, IL 60163 and is currently estimated at $366,981, approximately $198 per square foot. 5935 W Maple Ave is a home located in Cook County with nearby schools including Macarthur Intermediate School, Sunnyside Elementary School, and Proviso West High School.
Ownership History
Date
Name
Owned For
Owner Type
Purchase Details
Closed on
Jan 16, 2006
Sold by
Sabbini Raymond
Bought by
Sabbini Raymond and Sabbini Rita M
Current Estimated Value
Home Financials for this Owner
Home Financials are based on the most recent Mortgage that was taken out on this home.
Original Mortgage
$143,115
Outstanding Balance
$79,758
Interest Rate
6.42%
Mortgage Type
FHA
Estimated Equity
$287,223
Purchase Details
Closed on
Dec 23, 2003
Sold by
Gogana Sukhbir and Gogana Shashi
Bought by
Sabbini Raymond
Home Financials for this Owner
Home Financials are based on the most recent Mortgage that was taken out on this home.
Original Mortgage
$208,000
Interest Rate
5.5%
Mortgage Type
New Conventional
Purchase Details
Closed on
Oct 22, 2002
Sold by
Reedy Robert T and Reedy Barbara E
Bought by
Gogana Sukhbir and Gogana Shashi
Home Financials for this Owner
Home Financials are based on the most recent Mortgage that was taken out on this home.
Original Mortgage
$120,000
Interest Rate
6.08%
Create a Home Valuation Report for This Property
The Home Valuation Report is an in-depth analysis detailing your home's value as well as a comparison with similar homes in the area
Home Values in the Area
Average Home Value in this Area
Purchase History
| Date | Buyer | Sale Price | Title Company |
|---|---|---|---|
| Sabbini Raymond | -- | Preferred Title Ins Agency | |
| Sabbini Raymond | $260,000 | 1St American Title | |
| Gogana Sukhbir | $240,000 | -- |
Source: Public Records
Mortgage History
| Date | Status | Borrower | Loan Amount |
|---|---|---|---|
| Open | Sabbini Raymond | $143,115 | |
| Closed | Sabbini Raymond | $208,000 | |
| Previous Owner | Gogana Sukhbir | $120,000 | |
| Closed | Sabbini Raymond | $52,000 |
Source: Public Records
Tax History
| Year | Tax Paid | Tax Assessment Tax Assessment Total Assessment is a certain percentage of the fair market value that is determined by local assessors to be the total taxable value of land and additions on the property. | Land | Improvement |
|---|---|---|---|---|
| 2025 | $3,482 | $28,000 | $5,280 | $22,720 |
| 2024 | $3,482 | $28,000 | $5,280 | $22,720 |
| 2023 | $4,259 | $28,000 | $5,280 | $22,720 |
| 2022 | $4,259 | $22,845 | $3,600 | $19,245 |
| 2021 | $4,134 | $22,845 | $3,600 | $19,245 |
| 2020 | $3,631 | $22,845 | $3,600 | $19,245 |
| 2019 | $4,120 | $19,792 | $3,360 | $16,432 |
| 2018 | $4,046 | $19,792 | $3,360 | $16,432 |
| 2017 | $3,800 | $19,792 | $3,360 | $16,432 |
| 2016 | $5,150 | $17,005 | $3,120 | $13,885 |
| 2015 | $6,863 | $17,005 | $3,120 | $13,885 |
| 2014 | $4,994 | $17,005 | $3,120 | $13,885 |
| 2013 | $5,181 | $18,657 | $3,120 | $15,537 |
Source: Public Records
Map
Nearby Homes
- 5949 School St
- 593 S Edgewood Ave
- 1428 1/2 N Ashbel Ave
- 1447 N Ashbel Ave
- 515 S Parkview Ave
- 4938 W Randolph St
- 1529 N Hillside Ave
- 5706 Saint Charles Rd
- 5700 Saint Charles Rd
- 504 N Irving Ave
- 4904 W Hawthorne Ave
- 2050 Atwood Ave
- 522 E Park Manor Ct
- 330 E Saint Charles Rd
- 605 N Wolf Rd Unit B9
- 250 N Irving Ave
- 1038 Arthur Ave
- 520 N Wolf Rd Unit 203
- 406 S Poplar Ave
- 251 E South St
- 5931 W Maple Ave
- 5945 W Maple Ave
- 5927 W Maple Ave
- 5947 W Maple Ave
- 5923 W Maple Ave
- 1722 Victoria Ave
- 5944 W Maple Ave
- 5928 W Maple Ave
- 5949 W Maple Ave
- 1726 Victoria Ave
- 5924 W Maple Ave
- 5946 W Maple Ave
- 5916 W Maple Ave
- 5920 W Maple Ave
- 5951 W Maple Ave
- 5948 W Maple Ave
- 1630 Victoria Ave
- 5953 W Maple Ave
- 5909 W Maple Ave
- 5912 W Maple Ave
Your Personal Tour Guide
Ask me questions while you tour the home.