5936 Hickory #4 St Unit 4 Carpinteria, CA 93013
Estimated Value: $650,000 - $683,457
2
Beds
1
Bath
945
Sq Ft
$710/Sq Ft
Est. Value
About This Home
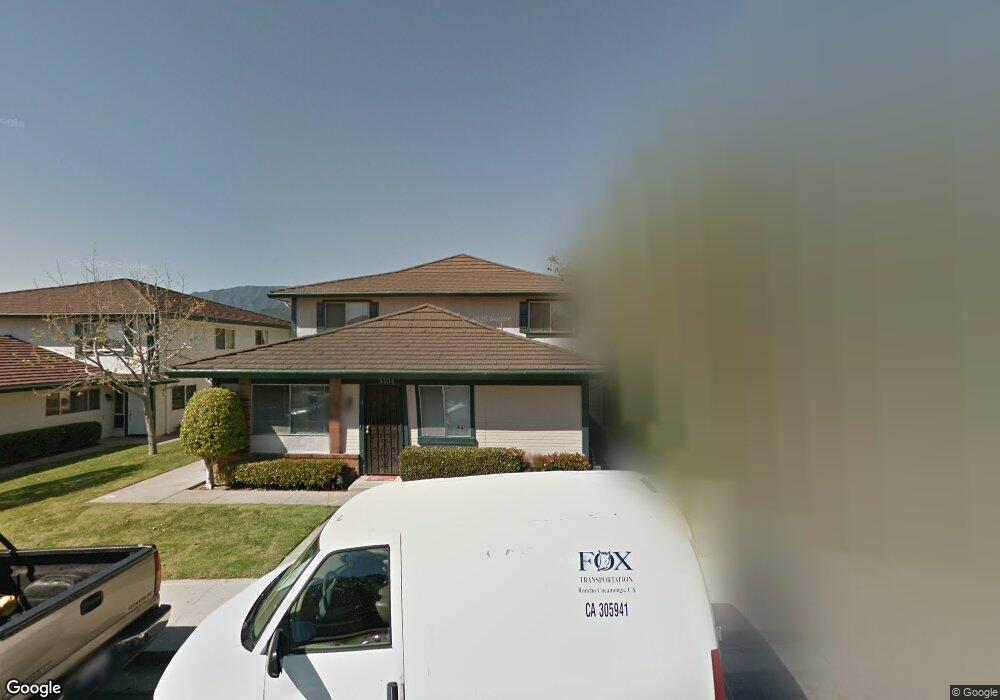
This home is located at 5936 Hickory #4 St Unit 4, Carpinteria, CA 93013 and is currently estimated at $671,364, approximately $710 per square foot. 5936 Hickory #4 St Unit 4 is a home located in Santa Barbara County with nearby schools including Carpinteria Senior High School, The Howard School, and Cate School.
Ownership History
Date
Name
Owned For
Owner Type
Purchase Details
Closed on
Oct 26, 2001
Sold by
Dugan Timothy and Dugan Tammy
Bought by
Muzzio Michael A and Muzzio Claudia
Current Estimated Value
Home Financials for this Owner
Home Financials are based on the most recent Mortgage that was taken out on this home.
Original Mortgage
$196,000
Outstanding Balance
$76,663
Interest Rate
6.73%
Estimated Equity
$594,701
Purchase Details
Closed on
Jun 7, 1999
Sold by
Kaempf Larry A and Kaempf Harriet
Bought by
Dugan Timothy and Dugan Tammy
Home Financials for this Owner
Home Financials are based on the most recent Mortgage that was taken out on this home.
Original Mortgage
$154,133
Interest Rate
6.9%
Purchase Details
Closed on
Jun 12, 1995
Sold by
Banks Marie T and Thomas Robert G
Bought by
Williams Robert B and Williams Natasha
Home Financials for this Owner
Home Financials are based on the most recent Mortgage that was taken out on this home.
Original Mortgage
$83,200
Interest Rate
7.92%
Create a Home Valuation Report for This Property
The Home Valuation Report is an in-depth analysis detailing your home's value as well as a comparison with similar homes in the area
Home Values in the Area
Average Home Value in this Area
Purchase History
| Date | Buyer | Sale Price | Title Company |
|---|---|---|---|
| Muzzio Michael A | $245,000 | Stewart Title | |
| Dugan Timothy | $159,000 | First American Title | |
| Williams Robert B | $104,000 | Santa Barbara Title Company |
Source: Public Records
Mortgage History
| Date | Status | Borrower | Loan Amount |
|---|---|---|---|
| Open | Muzzio Michael A | $196,000 | |
| Previous Owner | Dugan Timothy | $154,133 | |
| Previous Owner | Williams Robert B | $83,200 | |
| Closed | Muzzio Michael A | $24,500 |
Source: Public Records
Tax History
| Year | Tax Paid | Tax Assessment Tax Assessment Total Assessment is a certain percentage of the fair market value that is determined by local assessors to be the total taxable value of land and additions on the property. | Land | Improvement |
|---|---|---|---|---|
| 2025 | $4,560 | $361,915 | $177,264 | $184,651 |
| 2023 | $4,560 | $347,864 | $170,382 | $177,482 |
| 2022 | $4,385 | $341,044 | $167,042 | $174,002 |
| 2021 | $4,284 | $334,358 | $163,767 | $170,591 |
| 2020 | $4,220 | $330,930 | $162,088 | $168,842 |
| 2019 | $4,124 | $324,442 | $158,910 | $165,532 |
| 2018 | $4,043 | $318,082 | $155,795 | $162,287 |
| 2017 | $3,959 | $311,846 | $152,741 | $159,105 |
| 2016 | $3,890 | $305,733 | $149,747 | $155,986 |
| 2015 | $3,852 | $301,141 | $147,498 | $153,643 |
| 2014 | $3,636 | $295,243 | $144,609 | $150,634 |
Source: Public Records
Map
Nearby Homes
- 5945 Hickory St Unit 4
- 5930 Via Real Unit 3
- 5910 Via Real Unit 1
- 1025 Palmetto Way Unit I
- 6180 Via Real Unit 69
- 6180 Via Real Unit 29
- 6180 Via Real Unit 52
- 1197 Calle Lagunitas
- 5750 Via Real Unit 204
- 5700 Via Real Unit 106
- 5700 Via Real Unit 138
- 1214 Lomita Ln
- 5455 8th St Unit 58
- 5455 8th St Unit 95
- 5455 8th St Unit 5
- 5402 Cameo Rd
- 6660 Gobernador Canyon Rd
- 0 Gobernador Canyon Rd
- 855 Walnut Ave
- 876 Elm Ave
- 5936 Hickory #2 Unit 2
- 5936 Hickory Apt 3 St
- 5936 Hickory St Unit 4
- 5936 Hickory St Unit 3
- 5936 Hickory St Unit 2
- 5936 Hickory St Unit 1
- 5940 Hickory #2 Unit 2
- 5930 Hickory Ave Unit 4
- 5940 Hickory St Unit 4
- 5940 Hickory St Unit 3
- 5940 Hickory St Unit 2
- 5940 Hickory St Unit 1
- 5940 Hickory Apt 2 St
- 5930 Hickory St Unit 4
- 5930 Hickory St Unit 3
- 5930 Hickory St Unit 2
- 5930 Hickory St Unit 1
- 0000 Hickory St
- 5926 Hickory Apt 1
- 5935 Birch 4 Unit 4
Your Personal Tour Guide
Ask me questions while you tour the home.