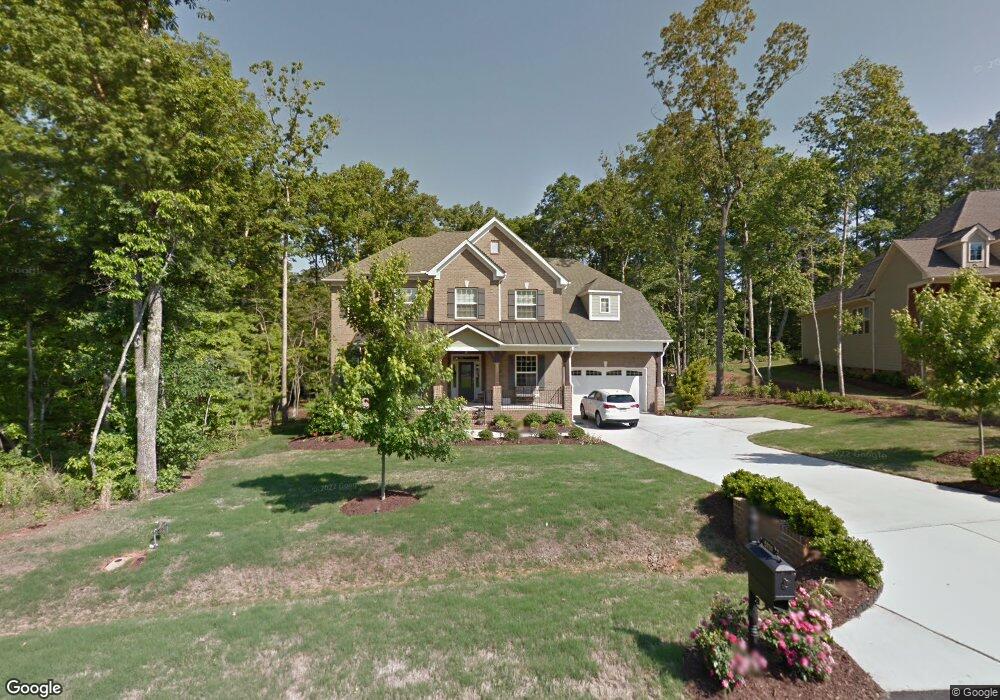
5936 Terrington Ln Unit 7 Raleigh, NC 27606
Middle Creek NeighborhoodEstimated Value: $996,000 - $1,158,584
--
Bed
1
Bath
3,966
Sq Ft
$267/Sq Ft
Est. Value
About This Home
This home is located at 5936 Terrington Ln Unit 7, Raleigh, NC 27606 and is currently estimated at $1,059,146, approximately $267 per square foot. 5936 Terrington Ln Unit 7 is a home located in Wake County with nearby schools including Swift Creek Elementary School, Dillard Drive Magnet Middle School, and Adventist Christian Academy of Raleigh.
Ownership History
Date
Name
Owned For
Owner Type
Purchase Details
Closed on
Mar 6, 2012
Sold by
Lennar Carolinas Llc
Bought by
Foreman Shannon C and Foreman Michael B
Current Estimated Value
Home Financials for this Owner
Home Financials are based on the most recent Mortgage that was taken out on this home.
Original Mortgage
$388,000
Outstanding Balance
$268,176
Interest Rate
4%
Mortgage Type
New Conventional
Estimated Equity
$790,970
Purchase Details
Closed on
Jun 30, 2010
Sold by
Crm Mid Atlantic Properties Llc
Bought by
Lennar Carolinas Llc
Purchase Details
Closed on
Jan 19, 2010
Sold by
American Heritage Homes Inc
Bought by
Crm Mid Atlantic Properties Llc
Create a Home Valuation Report for This Property
The Home Valuation Report is an in-depth analysis detailing your home's value as well as a comparison with similar homes in the area
Home Values in the Area
Average Home Value in this Area
Purchase History
| Date | Buyer | Sale Price | Title Company |
|---|---|---|---|
| Foreman Shannon C | $486,000 | None Available | |
| Lennar Carolinas Llc | -- | None Available | |
| Lennar Carolinas Llc | $1,100,000 | None Available | |
| Crm Mid Atlantic Properties Llc | $1,449,000 | None Available |
Source: Public Records
Mortgage History
| Date | Status | Borrower | Loan Amount |
|---|---|---|---|
| Open | Foreman Shannon C | $388,000 |
Source: Public Records
Tax History Compared to Growth
Tax History
| Year | Tax Paid | Tax Assessment Tax Assessment Total Assessment is a certain percentage of the fair market value that is determined by local assessors to be the total taxable value of land and additions on the property. | Land | Improvement |
|---|---|---|---|---|
| 2025 | $8,236 | $958,597 | $200,000 | $758,597 |
| 2024 | $8,058 | $958,597 | $200,000 | $758,597 |
| 2023 | $6,334 | $630,108 | $145,000 | $485,108 |
| 2022 | $6,097 | $630,108 | $145,000 | $485,108 |
| 2021 | $5,975 | $630,108 | $145,000 | $485,108 |
| 2020 | $6,006 | $630,108 | $145,000 | $485,108 |
| 2019 | $6,124 | $570,113 | $118,000 | $452,113 |
| 2018 | $5,746 | $570,113 | $118,000 | $452,113 |
| 2017 | $5,522 | $570,113 | $118,000 | $452,113 |
| 2016 | $5,439 | $570,113 | $118,000 | $452,113 |
| 2015 | $5,608 | $567,590 | $110,000 | $457,590 |
| 2014 | $5,287 | $567,590 | $110,000 | $457,590 |
Source: Public Records
Map
Nearby Homes
- 6801 Holly Springs Rd
- 7000 Holly Springs Rd
- 7029 Spring Ridge Rd
- 4001 Campbell Rd
- 105 Hounslow Ct
- 131 Longbridge Dr
- 1820 Yates Wheel Way
- 647 Newlyn Dr
- 107 Tower Hamlet Dr
- 3913 Littlefield Ct
- 102 Greygate Place
- 6121 Yates Mill Pond Rd
- 104 Jersey Ridge Rd
- 406 Cricketfield Ln
- 1900 High Oaks Ln
- 1629 Layhill Dr
- 1712 Layhill Dr
- 1716 Layhill Dr
- 1708 Layhill Dr
- 1704 Layhill Dr
- 5936 Terrington Ln
- 5932 Terrington Ln
- 5932 Terrington Ln Unit 6
- 5928 Terrington Ln Unit 5
- 5944 Terrington Ln
- 5944 Terrington Ln Unit 9
- 5937 Terrington Ln
- 5937 Terrington Ln Unit 14
- 5929 Terrington Ln
- 5929 Terrington Ln Unit 15
- 5924 Terrington Ln
- 5924 Terrington Ln Unit 4
- 3250 Campbell Rd
- 5949 Terrington Ln
- 5949 Terrington Ln Unit 13
- 5948 Terrington Ln
- 5952 Terrington Ln
- 5920 Terrington Ln
- 5920 Terrington Ln Unit 3
- 5953 Terrington Ln