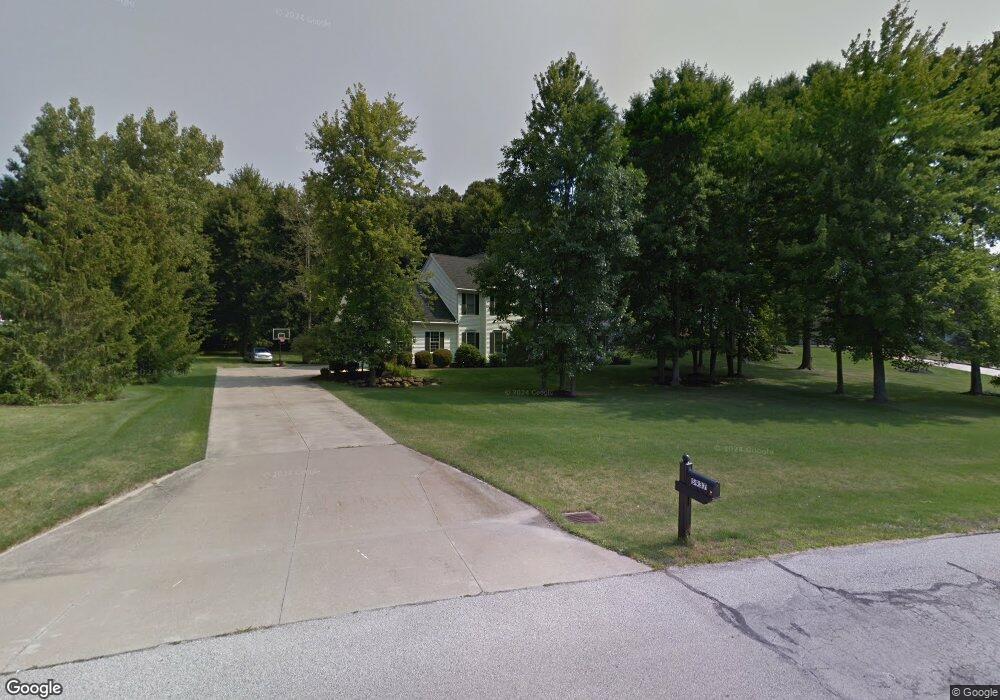
5937 Nicholson Dr Hudson, OH 44236
Estimated Value: $549,419 - $627,000
4
Beds
3
Baths
3,150
Sq Ft
$189/Sq Ft
Est. Value
About This Home
This home is located at 5937 Nicholson Dr, Hudson, OH 44236 and is currently estimated at $593,855, approximately $188 per square foot. 5937 Nicholson Dr is a home located in Summit County with nearby schools including Ellsworth Hill Elementary School, East Woods Intermediate School, and Hudson Middle School.
Ownership History
Date
Name
Owned For
Owner Type
Purchase Details
Closed on
Sep 17, 2021
Sold by
Silk Adam M and Silk Peggy J
Bought by
Murphy Mark Robert and Murphy Natalie Christine
Current Estimated Value
Home Financials for this Owner
Home Financials are based on the most recent Mortgage that was taken out on this home.
Original Mortgage
$240,000
Outstanding Balance
$183,193
Interest Rate
2.1%
Mortgage Type
Future Advance Clause Open End Mortgage
Estimated Equity
$410,662
Purchase Details
Closed on
Jul 15, 2015
Sold by
Silk Adam M and Silk Peggy J
Bought by
Silk Adam M and Silk Peggy J
Purchase Details
Closed on
Jul 24, 2000
Sold by
Hudson Builders Inc
Bought by
Silk Adam M and Silk Peggy J
Home Financials for this Owner
Home Financials are based on the most recent Mortgage that was taken out on this home.
Original Mortgage
$265,000
Interest Rate
7.5%
Create a Home Valuation Report for This Property
The Home Valuation Report is an in-depth analysis detailing your home's value as well as a comparison with similar homes in the area
Home Values in the Area
Average Home Value in this Area
Purchase History
| Date | Buyer | Sale Price | Title Company |
|---|---|---|---|
| Murphy Mark Robert | $300,000 | Revere Title | |
| Silk Adam M | -- | Attorney | |
| Silk Adam M | $75,000 | Midland Commerce Group |
Source: Public Records
Mortgage History
| Date | Status | Borrower | Loan Amount |
|---|---|---|---|
| Open | Murphy Mark Robert | $240,000 | |
| Previous Owner | Silk Adam M | $265,000 |
Source: Public Records
Tax History
| Year | Tax Paid | Tax Assessment Tax Assessment Total Assessment is a certain percentage of the fair market value that is determined by local assessors to be the total taxable value of land and additions on the property. | Land | Improvement |
|---|---|---|---|---|
| 2024 | $10,340 | $200,617 | $57,337 | $143,280 |
| 2023 | $10,340 | $200,617 | $57,337 | $143,280 |
| 2022 | $9,434 | $163,104 | $46,617 | $116,487 |
| 2021 | $9,666 | $163,104 | $46,617 | $116,487 |
| 2020 | $9,285 | $163,110 | $46,620 | $116,490 |
| 2019 | $9,886 | $160,910 | $57,370 | $103,540 |
| 2018 | $9,851 | $160,910 | $57,370 | $103,540 |
| 2017 | $9,369 | $160,910 | $57,370 | $103,540 |
| 2016 | $9,435 | $148,580 | $57,370 | $91,210 |
| 2015 | $9,369 | $148,580 | $57,370 | $91,210 |
| 2014 | $9,395 | $148,580 | $57,370 | $91,210 |
| 2013 | $7,416 | $113,780 | $57,370 | $56,410 |
Source: Public Records
Map
Nearby Homes
- 6101 Independence Dr
- 479 W Streetsboro St Unit B
- 20 Stratford Rd
- 54 E Case Dr
- 734 Barlow Rd
- 3 Hudson Common Dr Unit 3
- 235 Bridgewater Cir
- 381 Boston Mills Rd
- 77 Atterbury Blvd Unit 308
- 77 Atterbury Blvd Unit 107
- 186 S Main St
- 5752 Bridgewater Blvd
- 34 Chadbourne Dr
- 503 Cutler Ln
- 61 Lake Forest Dr
- 103 Chadbourne Dr
- 6559 Rosewood Trail
- 85 Maple Dr
- 12 N Oviatt St
- 569 Atterbury Blvd
- 5929 Nicholson Dr
- 5943 Nicholson Dr
- 5923 Nicholson Dr
- 5934 Nicholson Dr
- 5946 Nicholson Dr
- 5955 Nicholson Dr
- 5915 Nicholson Dr
- 6025 Leslie Dr
- 6037 Leslie Dr
- 6013 Leslie Dr
- 5954 Nicholson Dr
- 5912 Nicholson Dr
- 6003 Leslie Dr
- 5905 Nicholson Dr
- 6045 Leslie Dr
- 5967 Nicholson Dr
- 5900 Nicholson Dr
- 5962 Nicholson Dr
- 61 Leslie Dr
- 5895 Nicholson Dr
Your Personal Tour Guide
Ask me questions while you tour the home.