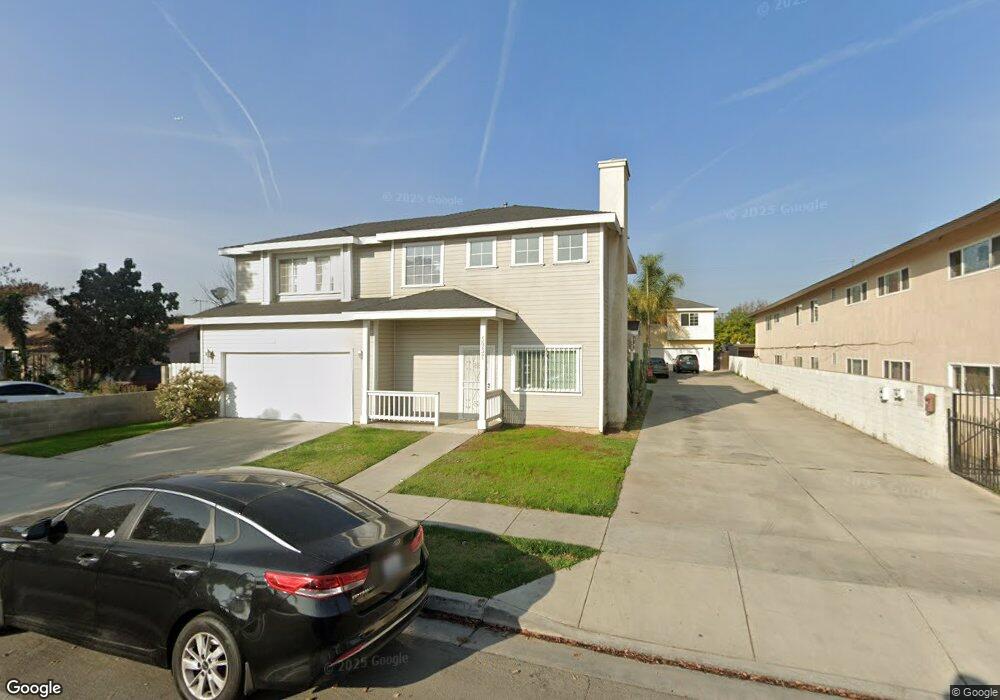
5937 Quinn St Bell Gardens, CA 90201
Estimated Value: $627,000 - $873,000
3
Beds
3
Baths
1,546
Sq Ft
$478/Sq Ft
Est. Value
About This Home
This home is located at 5937 Quinn St, Bell Gardens, CA 90201 and is currently estimated at $738,499, approximately $477 per square foot. 5937 Quinn St is a home located in Los Angeles County with nearby schools including Bell Gardens Elementary School, Bell Gardens Intermediate School, and Bell Gardens High.
Ownership History
Date
Name
Owned For
Owner Type
Purchase Details
Closed on
Jan 6, 2016
Sold by
Kim Hak Kyu
Bought by
Kim Augustine and Kim Hak Kyu
Current Estimated Value
Purchase Details
Closed on
Nov 19, 2009
Sold by
Nam Sang Hee
Bought by
Kim Hak Kyu
Home Financials for this Owner
Home Financials are based on the most recent Mortgage that was taken out on this home.
Original Mortgage
$291,620
Outstanding Balance
$190,319
Interest Rate
4.99%
Mortgage Type
FHA
Estimated Equity
$548,180
Purchase Details
Closed on
Oct 28, 2009
Sold by
Castanon Antonio and Castanon Maria
Bought by
Kim Hak Kyu
Home Financials for this Owner
Home Financials are based on the most recent Mortgage that was taken out on this home.
Original Mortgage
$291,620
Outstanding Balance
$190,319
Interest Rate
4.99%
Mortgage Type
FHA
Estimated Equity
$548,180
Purchase Details
Closed on
Apr 29, 2002
Sold by
Udi Development Company Inc
Bought by
Castanon Antonio
Create a Home Valuation Report for This Property
The Home Valuation Report is an in-depth analysis detailing your home's value as well as a comparison with similar homes in the area
Home Values in the Area
Average Home Value in this Area
Purchase History
| Date | Buyer | Sale Price | Title Company |
|---|---|---|---|
| Kim Augustine | -- | None Available | |
| Kim Hak Kyu | -- | Lawyers Title Company | |
| Kim Hak Kyu | $297,000 | Lawyers Title | |
| Castanon Antonio | $169,500 | -- |
Source: Public Records
Mortgage History
| Date | Status | Borrower | Loan Amount |
|---|---|---|---|
| Open | Kim Hak Kyu | $291,620 | |
| Closed | Castanon Antonio | $0 |
Source: Public Records
Tax History Compared to Growth
Tax History
| Year | Tax Paid | Tax Assessment Tax Assessment Total Assessment is a certain percentage of the fair market value that is determined by local assessors to be the total taxable value of land and additions on the property. | Land | Improvement |
|---|---|---|---|---|
| 2025 | $5,381 | $383,353 | $136,688 | $246,665 |
| 2024 | $5,381 | $375,837 | $134,008 | $241,829 |
| 2023 | $5,371 | $368,469 | $131,381 | $237,088 |
| 2022 | $5,160 | $361,245 | $128,805 | $232,440 |
| 2021 | $4,924 | $354,163 | $126,280 | $227,883 |
| 2019 | $4,725 | $343,661 | $122,536 | $221,125 |
| 2018 | $4,779 | $336,924 | $120,134 | $216,790 |
| 2016 | $4,554 | $323,843 | $115,470 | $208,373 |
| 2015 | $4,252 | $318,980 | $113,736 | $205,244 |
| 2014 | $4,165 | $312,733 | $111,509 | $201,224 |
Source: Public Records
Map
Nearby Homes
- 6019 Gotham St
- 6017 Buell St
- 5800 Clara St
- 8306 Garfield Ave Unit 8308
- 5659 Quinn St
- 5526 Clara St
- 10930 Rio Hondo Dr
- 6032 Florence Ave
- 7209 Toler Ave
- 5259 Elizabeth St
- 6815 Colmar Ave
- 7214 Perry Rd
- 5231 1/2 Clara St
- 6524 El Selinda Ave
- 6539 Ajax Ave
- 7215 Emil Ave
- 5162 E Florence Ave Unit 58
- 7370 Rio Hondo Place
- 9301 Karmont Ave
- 6910 Chanslor Ave