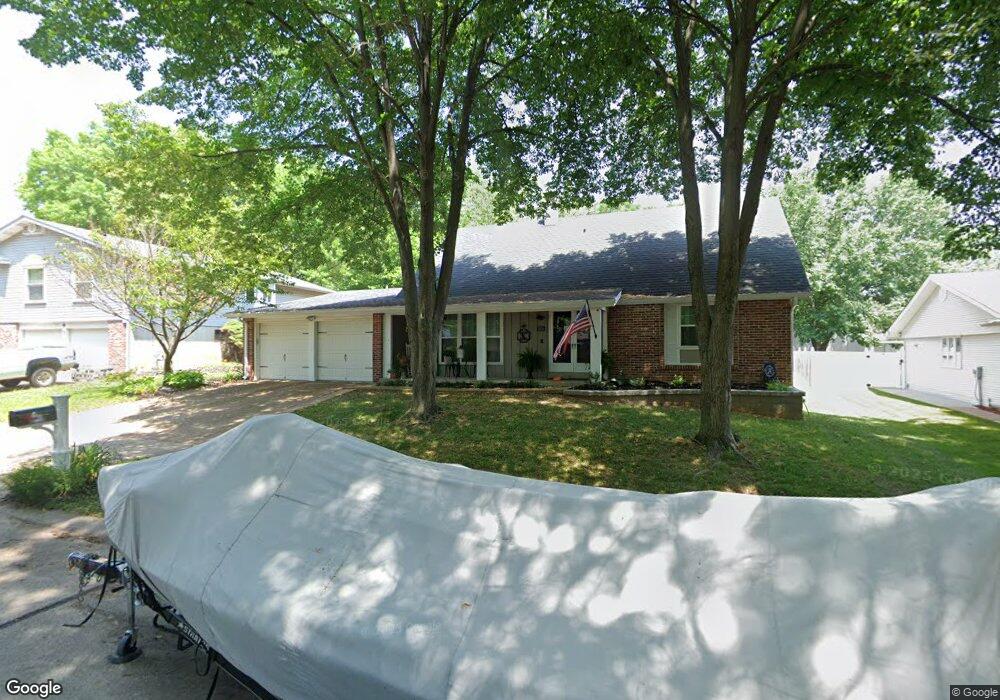
5938 Ponderosa Ct Saint Louis, MO 63128
Estimated Value: $377,000 - $420,000
3
Beds
3
Baths
2,044
Sq Ft
$194/Sq Ft
Est. Value
About This Home
This home is located at 5938 Ponderosa Ct, Saint Louis, MO 63128 and is currently estimated at $396,253, approximately $193 per square foot. 5938 Ponderosa Ct is a home located in St. Louis County with nearby schools including Hagemann Elementary School, Washington Middle School, and Mehlville High School.
Ownership History
Date
Name
Owned For
Owner Type
Purchase Details
Closed on
Aug 20, 2012
Sold by
Meadows Charlie E and Meadows Leanne D
Bought by
King Kyle D and King Jessica M
Current Estimated Value
Home Financials for this Owner
Home Financials are based on the most recent Mortgage that was taken out on this home.
Original Mortgage
$191,961
Outstanding Balance
$132,355
Interest Rate
3.57%
Mortgage Type
New Conventional
Estimated Equity
$263,898
Purchase Details
Closed on
Mar 3, 2011
Sold by
M & I Bank Fsb
Bought by
Meadows Charlie E and Meadows Leanne D
Home Financials for this Owner
Home Financials are based on the most recent Mortgage that was taken out on this home.
Original Mortgage
$157,893
Interest Rate
4.75%
Mortgage Type
FHA
Purchase Details
Closed on
Oct 5, 2010
Sold by
Laningham Julie and Laningham George
Bought by
M & I Bank Fsb
Create a Home Valuation Report for This Property
The Home Valuation Report is an in-depth analysis detailing your home's value as well as a comparison with similar homes in the area
Home Values in the Area
Average Home Value in this Area
Purchase History
| Date | Buyer | Sale Price | Title Company |
|---|---|---|---|
| King Kyle D | $199,000 | Investors Title Co Clayton | |
| Meadows Charlie E | $162,000 | First American Title | |
| M & I Bank Fsb | $167,833 | None Available |
Source: Public Records
Mortgage History
| Date | Status | Borrower | Loan Amount |
|---|---|---|---|
| Open | King Kyle D | $191,961 | |
| Previous Owner | Meadows Charlie E | $157,893 |
Source: Public Records
Tax History Compared to Growth
Tax History
| Year | Tax Paid | Tax Assessment Tax Assessment Total Assessment is a certain percentage of the fair market value that is determined by local assessors to be the total taxable value of land and additions on the property. | Land | Improvement |
|---|---|---|---|---|
| 2025 | $4,004 | $60,920 | $17,730 | $43,190 |
| 2024 | $4,004 | $59,640 | $11,840 | $47,800 |
| 2023 | $3,954 | $59,640 | $11,840 | $47,800 |
| 2022 | $3,226 | $48,860 | $9,610 | $39,250 |
| 2021 | $3,122 | $48,860 | $9,610 | $39,250 |
| 2020 | $3,438 | $51,220 | $8,870 | $42,350 |
| 2019 | $3,428 | $51,220 | $8,870 | $42,350 |
| 2018 | $2,981 | $40,170 | $7,390 | $32,780 |
| 2017 | $2,977 | $40,170 | $7,390 | $32,780 |
| 2016 | $3,008 | $38,950 | $7,390 | $31,560 |
| 2015 | $2,762 | $38,950 | $7,390 | $31,560 |
| 2014 | $2,433 | $33,930 | $6,760 | $27,170 |
Source: Public Records
Map
Nearby Homes
- 5028 Baldcypress Ct
- 5952 Shortleaf Ct
- 4968 Quail Crest Ct
- 5626 Greenton Way
- 5162 Hollow Wood Ct Unit D
- 5174 Hollow Wood Ct Unit C
- 5100 Hollow Wood Ct Unit D
- 5106 Hollow Wood Ct Unit C
- 5812 Chrisbrook Dr
- 5414 Village Courtway Ln
- 5116 Suson Oaks Ct
- 5714 Shining Day Place
- 13372 Bahnfyre Dr
- 5401 Green Cedar Way Unit 6
- 4523 Beaver Brook Ct
- 5408 Medalton Way
- 13266 East Ln
- 13449 Pocasset Dr
- 5527 Pierre Ct
- 13232 East Ln
- 5932 Ponderosa Ct
- 5944 Ponderosa Ct
- 5926 Ponderosa Ct
- 5950 Ponderosa Ct
- 5935 Ponderosa Ct
- 5943 Ponderosa Ct
- 5012 Baldcypress Ct
- 5951 Ponderosa Ct
- 5920 Ponderosa Ct
- 5956 Ponderosa Ct
- 5775 Greenton Way
- 5936 Wells Rd
- 5020 Baldcypress Ct
- 5914 Ponderosa Ct
- 5915 Ponderosa Ct
- 5962 Ponderosa Ct
- 5769 Greenton Way
- 5967 Ponderosa Ct
- 5908 Ponderosa Ct
- 5909 Ponderosa Ct